
Page 44 - Analytical Electrochemistry 2d Ed - Jospeh Wang
P. 44
2-1 CYCLIC VOLTAMMETRY 29
FIGURE 2-1 Potential±time excitation signal in cyclic voltammetric experiment.
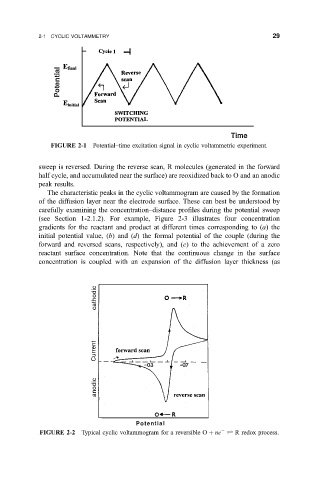
sweep is reversed. During the reverse scan, R molecules (generated in the forward
half cycle, and accumulated near the surface) are reoxidized back to O and an anodic
peak results.
The characteristic peaks in the cyclic voltammogram are caused by the formation
of the diffusion layer near the electrode surface. These can best be understood by
carefully examining the concentration±distance pro®les during the potential sweep
(see Section 1-2.1.2). For example, Figure 2-3 illustrates four concentration
gradients for the reactant and product at different times corresponding to (a) the
initial potential value, (b) and (d) the formal potential of the couple (during the
forward and reversed scans, respectively), and (c) to the achievement of a zero
reactant surface concentration. Note that the continuous change in the surface
concentration is coupled with an expansion of the diffusion layer thickness (as
FIGURE 2-2 Typical cyclic voltammogram for a reversible O ne R redox process.