
Page 45 - Analytical Electrochemistry 2d Ed - Jospeh Wang
P. 45
30 STUDY OF ELECTRODE REACTIONS
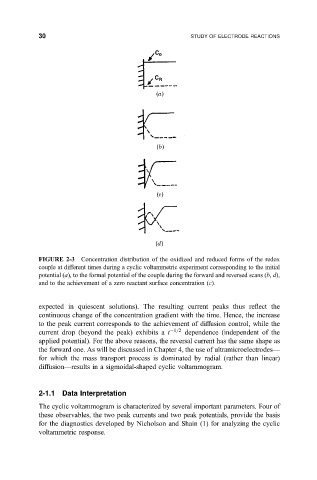
FIGURE 2-3 Concentration distribution of the oxidized and reduced forms of the redox
couple at different times during a cyclic voltammetric experiment corresponding to the initial
potential (a), to the formal potential of the couple during the forward and reversed scans (b, d),
and to the achievement of a zero reactant surface concentration (c).
expected in quiescent solutions). The resulting current peaks thus re¯ect the
continuous change of the concentration gradient with the time. Hence, the increase
to the peak current corresponds to the achievement of diffusion control, while the
current drop (beyond the peak) exhibits a t 1=2 dependence (independent of the
applied potential). For the above reasons, the reversal current has the same shape as
the forward one. As will be discussed in Chapter 4, the use of ultramicroelectrodesÐ
for which the mass transport process is dominated by radial (rather than linear)
diffusionÐresults in a sigmoidal-shaped cyclic voltammogram.
2-1.1 Data Interpretation
The cyclic voltammogram is characterized by several important parameters. Four of
these observables, the two peak currents and two peak potentials, provide the basis
for the diagnostics developed by Nicholson and Shain (1) for analyzing the cyclic
voltammetric response.