
Page 48 - Analytical Electrochemistry 2d Ed - Jospeh Wang
P. 48
2-1 CYCLIC VOLTAMMETRY 33
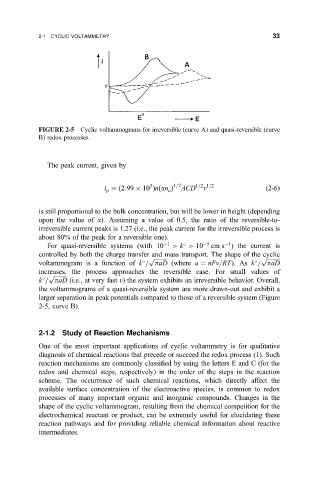
FIGURE 2-5 Cyclic voltammograms for irreversible (curve A) and quasi-reversible (curve
B) redox processes.
The peak current, given by
5 1=2 1=2 1=2
i
2:99 10 n
an ACD v
2-6
a
p
is still proportional to the bulk concentration, but will be lower in height (depending
upon the value of a). Assuming a value of 0.5, the ratio of the reversible-to-
irreversible current peaks is 1.27 (i.e., the peak current for the irreversible process is
about 80% of the peak for a reversible one).
1
For quasi-reversible systems (with 10 1 > k > 10 5 cm s ) the current is
controlled by both the charge transfer and mass transport. The shape of the cyclic
p p
voltammogram is a function of k = paD (where a nFv=RT). As k = paD
increases, the process approaches the reversible case. For small values of
p
k = paD (i.e., at very fast v) the system exhibits an irreversible behavior. Overall,
the voltammograms of a quasi-reversible system are more drawn-out and exhibit a
larger separation in peak potentials compared to those of a reversible system (Figure
2-5, curve B).
2-1.2 Study of Reaction Mechanisms
One of the most important applications of cyclic voltammetry is for qualitative
diagnosis of chemical reactions that precede or succeed the redox process (1). Such
reaction mechanisms are commonly classi®ed by using the letters E and C (for the
redox and chemical steps, respectively) in the order of the steps in the reaction
scheme. The occurrence of such chemical reactions, which directly affect the
available surface concentration of the electroactive species, is common to redox
processes of many important organic and inorganic compounds. Changes in the
shape of the cyclic voltammogram, resulting from the chemical competition for the
electrochemical reactant or product, can be extremely useful for elucidating these
reaction pathways and for providing reliable chemical information about reactive
intermediates.