
Page 52 - Analytical Electrochemistry 2d Ed - Jospeh Wang
P. 52
2-1 CYCLIC VOLTAMMETRY 37
adsorption±desorption process. Such interfacial behavior can occur in studies of
numerous organic compounds, as well as of metal complexes (if the ligand is
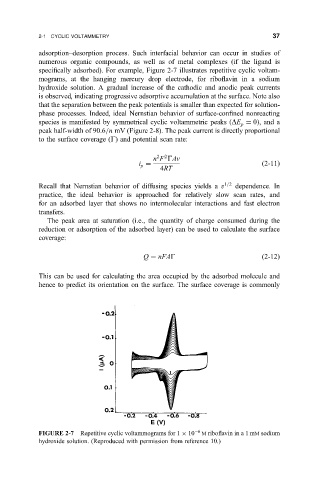
speci®cally adsorbed). For example, Figure 2-7 illustrates repetitive cyclic voltam-
mograms, at the hanging mercury drop electrode, for ribo¯avin in a sodium
hydroxide solution. A gradual increase of the cathodic and anodic peak currents
is observed, indicating progressive adsorptive accumulation at the surface. Note also
that the separation between the peak potentials is smaller than expected for solution-
phase processes. Indeed, ideal Nernstian behavior of surface-con®ned nonreacting
species is manifested by symmetrical cyclic voltammetric peaks
DE 0, and a
p
peak half-width of 90.6=n mV (Figure 2-8). The peak current is directly proportional
to the surface coverage (G) and potential scan rate:
2
2
n F GAv
i
2-11
p
4RT
Recall that Nernstian behavior of diffusing species yields a v 1=2 dependence. In
practice, the ideal behavior is approached for relatively slow scan rates, and
for an adsorbed layer that shows no intermolecular interactions and fast electron
transfers.
The peak area at saturation (i.e., the quantity of charge consumed during the
reduction or adsorption of the adsorbed layer) can be used to calculate the surface
coverage:
Q nFAG
2-12
This can be used for calculating the area occupied by the adsorbed molecule and
hence to predict its orientation on the surface. The surface coverage is commonly
FIGURE 2-7 Repetitive cyclic voltammograms for 1 10 6 M ribo¯avin in a 1 mM sodium
hydroxide solution. (Reproduced with permission from reference 10.)