
Page 56 - Analytical Electrochemistry 2d Ed - Jospeh Wang
P. 56
2-2 SPECTROELECTROCHEMISTRY 41
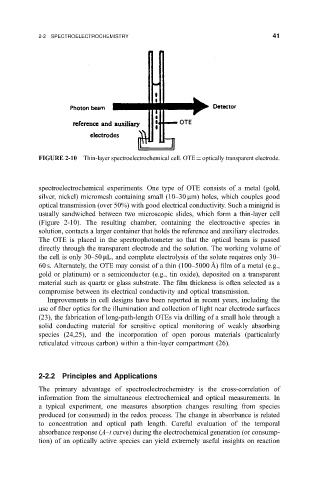
FIGURE 2-10 Thin-layer spectroelectrochemical cell. OTE optically transparent electrode.
spectroelectrochemical experiments. One type of OTE consists of a metal (gold,
silver, nickel) micromesh containing small (10±30 mm) holes, which couples good
optical transmission (over 50%) with good electrical conductivity. Such a minigrid is
usually sandwiched between two microscopic slides, which form a thin-layer cell
(Figure 2-10). The resulting chamber, containing the electroactive species in
solution, contacts a larger container that holds the reference and auxiliary electrodes.
The OTE is placed in the spectrophotometer so that the optical beam is passed
directly through the transparent electrode and the solution. The working volume of
the cell is only 30±50 mL, and complete electrolysis of the solute requires only 30±
60 s. Alternately, the OTE may consist of a thin (100±5000 A Ê ) ®lm of a metal (e.g.,
gold or platinum) or a semiconductor (e.g., tin oxide), deposited on a transparent
material such as quartz or glass substrate. The ®lm thickness is often selected as a
compromise between its electrical conductivity and optical transmission.
Improvements in cell designs have been reported in recent years, including the
use of ®ber optics for the illumination and collection of light near electrode surfaces
(23), the fabrication of long-path-length OTEs via drilling of a small hole through a
solid conducting material for sensitive optical monitoring of weakly absorbing
species (24,25), and the incorporation of open porous materials (particularly
reticulated vitreous carbon) within a thin-layer compartment (26).
2-2.2 Principles and Applications
The primary advantage of spectroelectrochemistry is the cross-correlation of
information from the simultaneous electrochemical and optical measurements. In
a typical experiment, one measures absorption changes resulting from species
produced (or consumed) in the redox process. The change in absorbance is related
to concentration and optical path length. Careful evaluation of the temporal
absorbance response (A±t curve) during the electrochemical generation (or consump-
tion) of an optically active species can yield extremely useful insights on reaction