
Page 58 - Analytical Electrochemistry 2d Ed - Jospeh Wang
P. 58
2-2 SPECTROELECTROCHEMISTRY 43
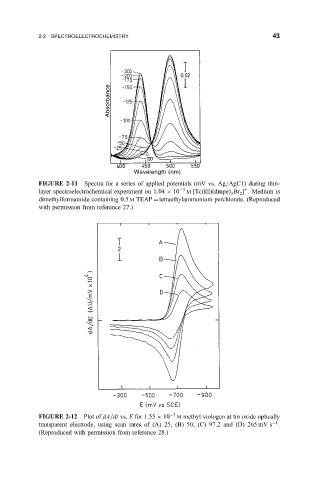
FIGURE 2-11 Spectra for a series of applied potentials (mV vs. Ag=AgC1) during thin-
layer spectroelectrochemical experiment on 1:04 10 3 M Tc
III
dmpe Br . Medium is
2 2
dimethylformamide containing 0.5 M TEAP tetraethylammonium perchlorate. (Reproduced
with permission from reference 27.)
FIGURE 2-12 Plot of dA=dt vs. E for 1:55 10 3 M methyl viologen at tin oxide optically
1
transparent electrode, using scan rates of (A) 25, (B) 50, (C) 97.2 and (D) 265 mV s .
(Reproduced with permission from reference 28.)