
Page 369 - Applied Numerical Methods Using MATLAB
P. 369
358 OPTIMIZATION
%nm7p01.m to perform the revised golden search method
f701 = inline(’x.*(x-2)’, ’x’);
a=0;b=3; r= (sqrt(5)-1)/2;
TolX = 1e-4; TolFun = 1e-4; MaxIter=100;
h=b-a;rh = r*h;
c=b-rh; d =a+rh;
fc = f701(c); fd = f701(d);
if fc < fd, [xo,fo] = opt_gs1(f701,a,c,fc,1 - r,d,r,TolX,TolFun,MaxIter)
else [xo,fo] = opt_gs1(f701,c,d,fd,r,b,r, TolX,TolFun,MaxIter)
end
7.2 Nelder–Mead, Steepest Descent, Newton, SA, GA and fminunc(), fmin-
search()
Consider a two-variable objective function
4 2 4 2
f(x) = x − 12x − 4x 1 + x − 16x − 5x 2 (P7.2.1)
1 1 2 2
− 20 cos(x 1 − 2.5) cos(x 2 − 2.9)
whose gradient vector function is
3
4x − 24x 1 − 4 + 20 sin(x 1 − 2.5) cos(x 2 − 2.9)
1
g(x) =∇f(x) =
3
4x − 32x 2 − 5 + 20 cos(x 1 − 2.5) sin(x 2 − 2.9)
2
(P7.2.2)
You have the MATLAB functions f7p02(), g7p02() defining the objective
function f(x) and its gradient function g(x). Youalsohaveapart ofthe
MATLAB program which plots a mesh/contour-type graphs for f (x). Note
that this gradient function has nine zeros as listed in Table P7.2.1.
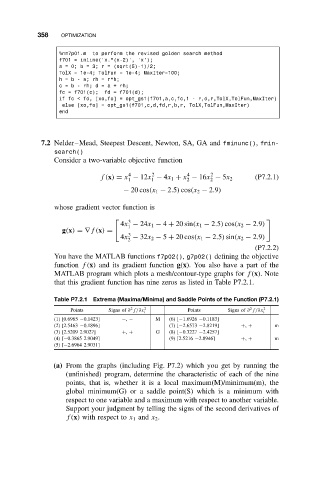
Table P7.2.1 Extrema (Maxima/Minima) and Saddle Points of the Function (P7.2.1)
2
2
Points Signs of ∂ f/∂x 2 Points Signs of ∂ f/∂x 2
i i
(1) [0.6965 −0.1423] −, − M (6) [−1.6926 −0.1183]
(2) [2.5463 −0.1896] (7) [−2.6573 −2.8219] +, + m
(3) [2.5209 2.9027] +, + G (8) [−0.3227 −2.4257]
(4) [−0.3865 2.9049] (9) [2.5216 −2.8946] +, + m
(5) [−2.6964 2.9031]
(a) From the graphs (including Fig. P7.2) which you get by running the
(unfinished) program, determine the characteristic of each of the nine
points, that is, whether it is a local maximum(M)/minimum(m), the
global minimum(G) or a saddle point(S) which is a minimum with
respect to one variable and a maximum with respect to another variable.
Support your judgment by telling the signs of the second derivatives of
f (x) with respect to x 1 and x 2 .