
Page 248 - Applied Petroleum Geomechanics
P. 248
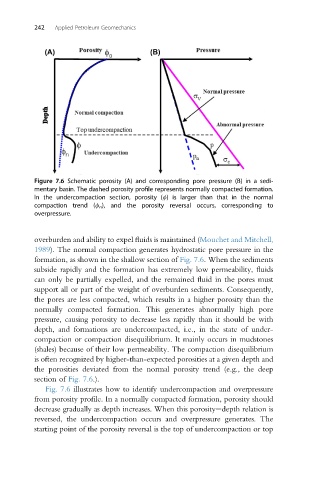
242   Applied Petroleum Geomechanics


          Figure 7.6 Schematic porosity (A) and corresponding pore pressure (B) in a sedi-
          mentary basin. The dashed porosity profile represents normally compacted formation.
          In the undercompaction section, porosity (f) is larger than that in the normal
          compaction trend (f n ), and the porosity reversal occurs, corresponding to
          overpressure.


          overburden and ability to expel fluids is maintained (Mouchet and Mitchell,
          1989). The normal compaction generates hydrostatic pore pressure in the
          formation, as shown in the shallow section of Fig. 7.6. When the sediments
          subside rapidly and the formation has extremely low permeability, fluids
          can only be partially expelled, and the remained fluid in the pores must
          support all or part of the weight of overburden sediments. Consequently,
          the pores are less compacted, which results in a higher porosity than the
          normally compacted formation. This generates abnormally high pore
          pressure, causing porosity to decrease less rapidly than it should be with
          depth, and formations are undercompacted, i.e., in the state of under-
          compaction or compaction disequilibrium. It mainly occurs in mudstones
          (shales) because of their low permeability. The compaction disequilibrium
          is often recognized by higher-than-expected porosities at a given depth and
          the porosities deviated from the normal porosity trend (e.g., the deep
          section of Fig. 7.6.).
             Fig. 7.6 illustrates how to identify undercompaction and overpressure
          from porosity profile. In a normally compacted formation, porosity should
          decrease gradually as depth increases. When this porosityedepth relation is
          reversed, the undercompaction occurs and overpressure generates. The
          starting point of the porosity reversal is the top of undercompaction or top