
Page 144 - Applied Probability
P. 144
128
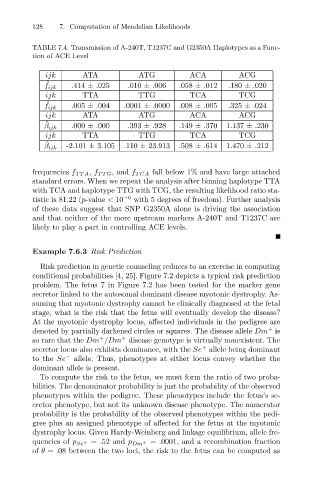
TABLE 7.4. Transmission of A-240T, T1237C and G2350A Haplotypes as a Func-
tion of ACE Level
ATG
ATA
ijk
ACG
ˆ
.414 ± .025
.010 ± .006
.058 ± .012
f ijk 7. Computation of Mendelian Likelihoods ACA .180 ± .020
ijk TTA TTG TCA TCG
ˆ
f ijk .005 ± .004 .0001 ± .0000 .008 ± .005 .325 ± .024
ijk ATA ATG ACA ACG
ˆ
β ijk .000 ± .000 .393 ± .928 .149 ± .370 1.137 ± .230
ijk TTA TTG TCA TCG
ˆ
β ijk -2.101 ± 3.105 .110 ± 23.913 .508 ± .614 1.470 ± .212
frequencies f TTA , f TTG , and f TCA fall below 1% and have large attached
standard errors. When we repeat the analysis after binning haplotype TTA
with TCA and haplotype TTG with TCG, the resulting likelihood ratio sta-
tistic is 81.22 (p-value < 10 −6 with 5 degrees of freedom). Further analysis
of these data suggest that SNP G2350A alone is driving the association
and that neither of the more upstream markers A-240T and T1237C are
likely to play a part in controlling ACE levels.
Example 7.6.3 Risk Prediction
Risk prediction in genetic counseling reduces to an exercise in computing
conditional probabilities [4, 25]. Figure 7.2 depicts a typical risk prediction
problem. The fetus 7 in Figure 7.2 has been tested for the marker gene
secretor linked to the autosomal dominant disease myotonic dystrophy. As-
suming that myotonic dystrophy cannot be clinically diagnosed at the fetal
stage, what is the risk that the fetus will eventually develop the disease?
At the myotonic dystrophy locus, affected individuals in the pedigree are
+
denoted by partially darkened circles or squares. The disease allele Dm is
+
+
so rare that the Dm /Dm disease genotype is virtually nonexistent. The
+
secretor locus also exhibits dominance, with the Se allele being dominant
to the Se − allele. Thus, phenotypes at either locus convey whether the
dominant allele is present.
To compute the risk to the fetus, we must form the ratio of two proba-
bilities. The denominator probability is just the probability of the observed
phenotypes within the pedigree. These phenotypes include the fetus’s se-
cretor phenotype, but not its unknown disease phenotype. The numerator
probability is the probability of the observed phenotypes within the pedi-
gree plus an assigned phenotype of affected for the fetus at the myotonic
dystrophy locus. Given Hardy-Weinberg and linkage equilibrium, allele fre-
+ = .0001, and a recombination fraction
quencies of p Se + = .52 and p Dm
of θ = .08 between the two loci, the risk to the fetus can be computed as