
Page 147 - Applied Probability
P. 147
1 2 7. Computation of Mendelian Likelihoods 131
Lod Score
0
0.0 0.1 0.2 0.3 0.4 0.5
-1
Theta
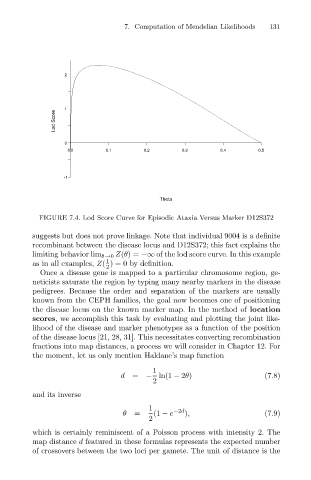
FIGURE 7.4. Lod Score Curve for Episodic Ataxia Versus Marker D12S372
suggests but does not prove linkage. Note that individual 9004 is a definite
recombinant between the disease locus and D12S372; this fact explains the
limiting behavior lim θ→0 Z(θ)= − of the lod score curve. In this example
1
as in all examples, Z( ) = 0 by definition.
2
Once a disease gene is mapped to a particular chromosome region, ge-
neticists saturate the region by typing many nearby markers in the disease
pedigrees. Because the order and separation of the markers are usually
known from the CEPH families, the goal now becomes one of positioning
the disease locus on the known marker map. In the method of location
scores, we accomplish this task by evaluating and plotting the joint like-
lihood of the disease and marker phenotypes as a function of the position
of the disease locus [21, 28, 31]. This necessitates converting recombination
fractions into map distances, a process we will consider in Chapter 12. For
the moment, let us only mention Haldane’s map function
1
d = − ln(1 − 2θ) (7.8)
2
and its inverse
1 −2d
θ = (1 − e ), (7.9)
2
which is certainly reminiscent of a Poisson process with intensity 2. The
map distance d featured in these formulas represents the expected number
of crossovers between the two loci per gamete. The unit of distance is the