
Page 145 - Applied Probability
P. 145
7. Computation of Mendelian Likelihoods
+
Se
1
2
Se + 129
Se + Se + Se −
3 4 5
♦
Se − Se −
6 7
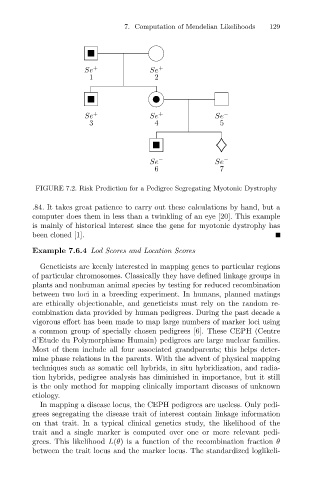
FIGURE 7.2. Risk Prediction for a Pedigree Segregating Myotonic Dystrophy
.84. It takes great patience to carry out these calculations by hand, but a
computer does them in less than a twinkling of an eye [20]. This example
is mainly of historical interest since the gene for myotonic dystrophy has
been cloned [1].
Example 7.6.4 Lod Scores and Location Scores
Geneticists are keenly interested in mapping genes to particular regions
of particular chromosomes. Classically they have defined linkage groups in
plants and nonhuman animal species by testing for reduced recombination
between two loci in a breeding experiment. In humans, planned matings
are ethically objectionable, and geneticists must rely on the random re-
combination data provided by human pedigrees. During the past decade a
vigorous effort has been made to map large numbers of marker loci using
a common group of specially chosen pedigrees [6]. These CEPH (Centre
d’Etude du Polymorphisme Humain) pedigrees are large nuclear families.
Most of them include all four associated grandparents; this helps deter-
mine phase relations in the parents. With the advent of physical mapping
techniques such as somatic cell hybrids, in situ hybridization, and radia-
tion hybrids, pedigree analysis has diminished in importance, but it still
is the only method for mapping clinically important diseases of unknown
etiology.
In mapping a disease locus, the CEPH pedigrees are useless. Only pedi-
grees segregating the disease trait of interest contain linkage information
on that trait. In a typical clinical genetics study, the likelihood of the
trait and a single marker is computed over one or more relevant pedi-
grees. This likelihood L(θ) is a function of the recombination fraction θ
between the trait locus and the marker locus. The standardized loglikeli-