
Page 148 - Applied Probability
P. 148
132
2 7. Computation of Mendelian Likelihoods
Location Score 0
-2
-5 0 5 10 15
Distance (d)
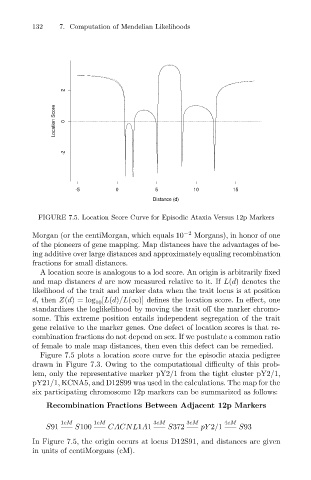
FIGURE 7.5. Location Score Curve for Episodic Ataxia Versus 12p Markers
Morgan (or the centiMorgan, which equals 10 −2 Morgans), in honor of one
of the pioneers of gene mapping. Map distances have the advantages of be-
ing additive over large distances and approximately equaling recombination
fractions for small distances.
A location score is analogous to a lod score. An origin is arbitrarily fixed
and map distances d are now measured relative to it. If L(d) denotes the
likelihood of the trait and marker data when the trait locus is at position
d, then Z(d)= log [L(d)/L(∞)] defines the location score. In effect, one
10
standardizes the loglikelihood by moving the trait off the marker chromo-
some. This extreme position entails independent segregation of the trait
gene relative to the marker genes. One defect of location scores is that re-
combination fractions do not depend on sex. If we postulate a common ratio
of female to male map distances, then even this defect can be remedied.
Figure 7.5 plots a location score curve for the episodic ataxia pedigree
drawn in Figure 7.3. Owing to the computational difficulty of this prob-
lem, only the representative marker pY2/1 from the tight cluster pY2/1,
pY21/1, KCNA5, and D12S99 was used in the calculations. The map for the
six participating chromosome 12p markers can be summarized as follows:
Recombination Fractions Between Adjacent 12p Markers
1cM 1cM 3cM 3cM 4cM
S91 —– S100 —– CACNL1A1 —– S372 —– pY 2/1 —– S93
In Figure 7.5, the origin occurs at locus D12S91, and distances are given
in units of centiMorgans (cM).