
Page 146 - Applied Probability
P. 146
130
7. Computation of Mendelian Likelihoods
?
markers
D12S91
2 •3
1 1
D12S100
5 •6
4 1
CACNL1A1
7•10
10 9
D12S372
2 2
2 •3
pY2/1
1 •2
1 5
pY21/1
7 5
10•7
3 4
4 •2
KCNA5 2002 2001
D12S99 6 4 5 •3
D12S93 7 4 4 •4
centromere
1001 1000 1002 1006 1007 1008 1009 1010 1011
1 3 •3 1 2 1 •3 1 3 3 •3 1 2 1 •3 1 3 3
3 3 •6 4 5 4 •6 4 6 4 •6 1 3 3 •6 1 4 2
9 9 •1010 7 10 •1010 8 1 •10 9 2 9 •10 9 8 9
5 4 •3 2 2 2 •3 2 3 2 •3 2 3 2 •3 2 3 3
6 6 •2 1 1 1 •2 1 6 6 •2 5 1 1 •2 5 6 1
3 4 •7 7 10 7 •7 7 4 7 •7 5 5 4 •7 5 5 4
3 4 •2 3 4 3 •2 3 2 4 •2 4 1 2 •2 4 4 1
1 5 •3 6 5 6 •3 6 3 6 •3 4 2 5 •3 4 4 3
6 6 •4 7 4 7 •4 7 4 3 •4 4 2 1 •4 4 4 4
199 100 102 103 1 104 114 113 115 116 117
4 4 1 1 •3 3 2 1 •3 1 3 1 •3 3 •3 3 •3 1 •3 3 1 3
3 3 4 3 •6 3 2 3 •6 3 3 4 •6 6 •6 4 •6 3 •6 2 1 4
9 10 10 9 •10 9 10 10 •10 9 9 9 •10 8 •10 1 •10 9 •10 9 9 8
3 4 2 5 •3 4 4 3 •3 5 2 3 •3 3 •3 2 •3 2 •3 3 2 3
2 5 1 6 •2 6 6 6 •2 6 6 6 •2 6 1 6 •2 1 •2 1 5 6
4 9 7 4 •7 4 4 3 •7 3 10 5 •7 4 7 4 •7 4 •7 4 5 5
3 3 3 3 •2 4 3 1 •2 3 1 1 •2 2 3 2 •2 2 •2 1 4 4
4 4 6 1 •3 5 4 6 •3 1 8 7 •3 3 6 3 •3 5 •3 3 4 4
1 2 7 6 •4 6 6 4 •4 6 3 6 •4 4 7 4 •4 1 •4 4 4 4
9097 9098 9099 9003 9004 9005 9006
4 1 4 1 4 1 2 •3 1 •3 1 •3 1 1
3 3 3 4 3 3 2 •6 3 •6 4 •6 4 3
9 9 10 10 9 9 10 •10 10 •10 9 •10 9 9
3 5 4 2 3 5 4 •3 3 •3 3 •3 3 5
2 6 5 1 2 6 6 •2 6 6 6 •2 6 6
4 4 9 7 4 4 4 •7 3 4 5 •7 5 3
3 3 3 3 3 3 3 •2 1 4 1 •2 1 3
4 1 4 6 4 1 4 •3 6 5 7 •3 7 1
1 6 2 7 1 6 6 •4 4 6 6 •4 6 6
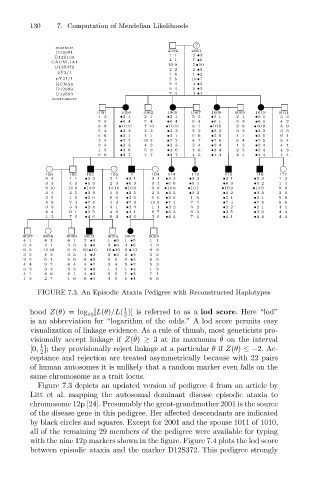
FIGURE 7.3. An Episodic Ataxia Pedigree with Reconstructed Haplotypes
1
hood Z(θ)= log [L(θ)/L( )] is referred to as a lod score. Here “lod”
10 2
is an abbreviation for “logarithm of the odds.” A lod score permits easy
visualization of linkage evidence. As a rule of thumb, most geneticists pro-
ˆ
ˆ
visionally accept linkage if Z(θ) ≥ 3 at its maximum θ on the interval
1
[0, ]; they provisionally reject linkage at a particular θ if Z(θ) ≤−2. Ac-
2
ceptance and rejection are treated asymmetrically because with 22 pairs
of human autosomes it is unlikely that a random marker even falls on the
same chromosome as a trait locus.
Figure 7.3 depicts an updated version of pedigree 4 from an article by
Litt et al. mapping the autosomal dominant disease episodic ataxia to
chromosome 12p [24]. Presumably the great-grandmother 2001 is the source
of the disease gene in this pedigree. Her affected descendants are indicated
by black circles and squares. Except for 2001 and the spouse 1011 of 1010,
all of the remaining 29 members of the pedigree were available for typing
with the nine 12p markers shown in the figure. Figure 7.4 plots the lod score
between episodic ataxia and the marker D12S372. This pedigree strongly