
Page 207 - APPLIED PROCESS DESIGN FOR CHEMICAL AND PETROCHEMICAL PLANTS, Volume 1, 3rd Edition
P. 207
180 Applied Process Design for Chemical and Petrochemical Plants
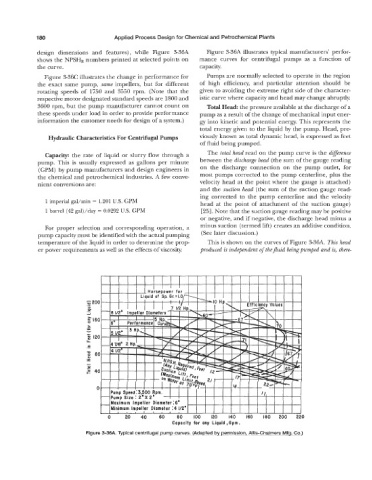
design dimensions and features), while Figure 3-36A Figure 3-36A illustrates typical manufacturers' perfor-
shows the NPSHR numbers printed at selected points on mance curves for centrifugal pumps as a function of
the curve. capacity.
Figure 3-36C illustrates the change in performance for Pumps are normally selected to operate in the region
the exact same pump, same impellers, but for different of high efficiency, and particular attention should be
rotating speeds of 1750 and 3550 rpm. (Note that the given to avoiding the extreme right side of the character-
respective motor designated standard speeds are 1800 and istic curve where capacity and head may change abruptly.
3600 rpm, but the pump manufacturer cannot count on Total Head the pressure available at the discharge of a
these speeds under load in order to provide performance pump as a result of the change of mechanical input ener-
information the customer needs for design of a system.) gy into kinetic and potential energy. This represents the
total energy given to the liquid by the pump. Head, pre-
Hydraulic Characteristics For Centrifugal Pumps viously known as total dynamic head, is expressed as feet
of fluid being pumped.
Capacity: the rate of liquid or slurry flow through a The total head read on the pump curve is the difference
pump. This is usually expressed as gallons per minute between the discharge head (the sum of the gauge reading
(GPM) by pump manufacturers and design engineers in on the discharge connection on the pump outlet, for
the chemical and petrochemical industries. A few conve- most pumps corrected to the pump centerline, plus the
nient conversions are: velocity head at the point where the gauge is attached)
and the suction head (the sum of the suction gauge read-
ing corrected to the pump centerline and the velocity
1 imperial gal/min = 1.201 U.S. GPM head at the point of attachment of the suction gauge)
1 barrel (42 gal)/day = 0.0292 U.S. GPM [25]. Note that the suction gauge reading may be positive
or 'negative, and if negative, the discharge head minus a
For proper selection and corresponding operation, a minus suction (termed lift) creates an additive condition.
pump capacity must be identified with the actual pumping (See later discussion.)
temperature of the liquid in order to determine the prop- This is shown on the curves of Figure 3-36A. This head
er power requirements as well as the effects of viscosity. produced is independent of thefluid beingpumped and is, there-
;; 200
.-
=
.-
0.
J
6 160
-
L
s
c
g 120
L.
.-
c
U
0 80
aD
-
-
I
0
40
0
0 20 40 60 80 100 120 140 160 180 200 220
Capacity for any Liquid ,Gpm.
Figure 3-36A. Typical centrifugal pump curves. (Adapted by permission, Allis-Chalmers Mfg. Co.)