
Page 128 - Applied Process Design For Chemical And Petrochemical Plants Volume II
P. 128
Distillation 117
gas. For hydrocarbon materials these factors can be devel- total heat of absorption or the rich oil outlet temperature
oped by using total heats. for system balance can be calculated. Thus, if a reasonable
The relation of Hull and Raymond [32] considers heat temperature balance is not obtained, the heat load for the
loss through the column wall, and indicates that either the intercoolers can be set.
Figure 8-60 presents actual total heats of absorption
based on experimental studies [32]. As long as the hydro-
carbon absorption is in the range of 8O-12O0F, the values
read from the graph should apply.
Estimation of discharge gas temperature may be made
from Figure 8-61 based on test data.
0 2 4 6 8 b The design of absorbers has not received the empirical
Top Section AH, BTU/lb. design guidelines study so prevalent in distillation prob-
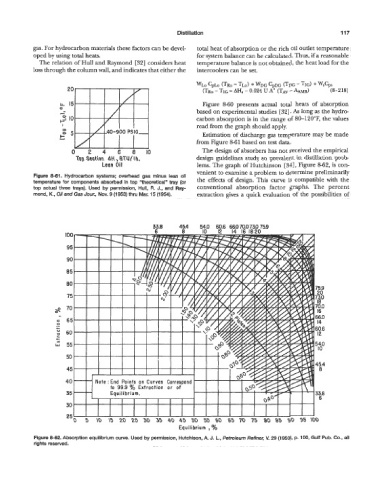
Lean Oil lems. The graph of Hutchinson [34], Figure 8-62, is con-
venient to examine a problem to determine preliminarily
Figure 8-61. Hydrocarbon systems; overhead gas minus lean oil the effects of design. This curve is compatible with the
temperature Tor components absorbed in top “theoretical” tray (or
top actual three trays). Used by permission, Hull, R. J., and Ray- conventional absorption factor graphs. The percent
mond, K., OI/ and Gas Jour., Nov. 9 (1 953) thru Mar. 15 (1 954). extraction gives a quick evaluation of the possibilities of
5 IO 15 20 25 30 35 40 45 50 55 60 65 70 75 80 85 90 95 100
Equilibrium , %
Figure 8-62. Absorption equilibrium curve. Used by permission, Hutchison, A. J. L., Petroleum Refiner, V. 29 (1950), p. 100, Gulf PI Jb. Co., all
rights resew red.