
Page 216 - Applied Process Design For Chemical And Petrochemical Plants Volume II
P. 216
Distillation 205
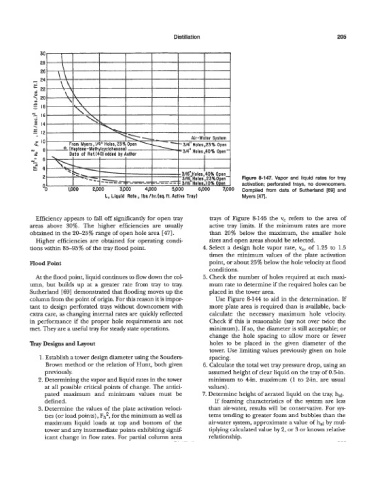
Figure 8-147. Vapor and liquid rates for tray
activation; perforated trays, no downcorners.
0 Compiled from data of Sutherland [69] and
L, Liquid Aafe, Ibs./hr.(sq.ft. Active fray) Myers [47.
Efficiency appears to fall off significantly for open tray trays of Figure 8-146 the v, refers to the area of
areas above 30%. The higher efficiencies are usually active tray limits. If the minimum rates are more
obtained in the 2&23% range of open hole area [47]. than 20% below the maximum, the smaller hole
Higher efficiencies are obtained for operating condi- sizes and open areas should be selected.
tions within 8595% of the tray flood point. 4. Select a design hole vapor rate, v,, of 1.25 to 1.5
times the minimum values of the plate activation
Flood Point point, or about 25% below the hole velocity at flood
conditions.
At the flood point, liquid continues to flow down the col- 5. Check the number of holes required at each maxi-
umn, but builds up at a greater rate from tray to tray. mum rate to determine if the required holes can be
Sutherland E691 demonstrated that flooding moves up the placed in the tower area.
column from the point of origin. For this reason it is impor- Use Figure 8-144 to aid in the determination. If
tant to design perforated trays without downcomers with more plate area is required than is available, back-
extra care, as changing internal rates are quickly reflected calculate the necessary maximum hole velocity.
in performance if the proper hole requirements are not Check if this is reasonable (say not over twice the
met. They are a useM tray for steady state operations. minimum). If so, the diameter is still acceptable; or
change the hole spacing to allow more or fewer
nay Designs and Layout holes to be placed in the given diameter of the
tower. Use limiting values previously given on hole
1. Establish a tower design diameter using the Souders- spacing.
Brown method or the relation of Hunt, both given 6. Calculate the total wet tray pressure drop, using an
previously. assumed height of clear liquid on the tray of 0.5-in.
2. Determining the vapor and liquid rates in the tower minimum to 4in. maximum (1 to 2-in. are usual
at all possible critical points of change. The antici- values).
pated maximum and minimum values must be 7. Determine height of aerated liquid on the tray, hd.
defined. If foaming characteristics of the system are less
3. Determine the values of the plate activation veloci- than air-water, results will be conservative. For sys-
ties (or load points), Fh2, for the minimum as well as tems tending to greater foam and bubbles than the
maximum liquid loads at top and bottom of the air-water system, approximate a value of ha] by mul-
tower and any intermediate points exhibiting signif- tiplying calculated value by 2, or 3 or known relative
icant change in flow rates. For partial column area relationship.