
Page 219 - Applied Process Design For Chemical And Petrochemical Plants Volume II
P. 219
208 Applied Process Design for Chemical and Petrochemical Plants
and has developed an approximation procedure suitable R\w = ratio, valve weight with legs/valve weight without
for estimating designs. This procedure then can be con- legs, dimensionless, Table 8-22.
firmed by the respective manufacturers’ examining for the C& = eddy loss coefficient, dimensionless, Table 8-22
unique application of their valve trays. Note that Klein’s K, = loss coefficient, valves closed (sec)2 (in.)/ft2, see
[201] references to the manufacturers design manuals are Table 8-23
somewhat earlier versions, but are not anticipated to signiE v, = v, = vapor velocity through tray active bubbling
area, ft/sec
icantly change the estimating value by the design engineer. F, = tray factor based on active bubbling area
Klein’s design method summary follows (by permission) : = v, = Vh G., (ft/sec) (m)
vm = valve metal density, lb/ft3, Table 8-24
Dry Tray Pressure Drop pv = vapor density, lb/ft3
g = acceleration of gravity, 32 ft/ (sec-sec)
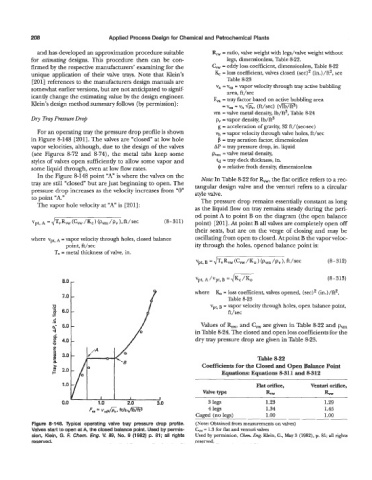
For an operating tray the pressure drop profile is shown vh = vapor velocity through valve holes, ft/sec
in Figure 8-148 [201]. The valves are “closed at low hole p = tray aeration factor, dimensionless
vapor velocities, although, due to the design of the valves AP = tray pressure drop, in. liquid
(see Figures 8-72 and &74), the metal tabs keep some pvm = valve metal density,
styles of valves open sufficiently to allow some vapor and = tray deck thickness, in.
some liquid through, even at low flow rates. $ = relative froth density, dimensionless
In the Figure g148 point “A” is where the valves on the
Note: In Table 8-22 for Rw, the flat orifice refers to a rec-
tray are still “closed but are just beginning to open. The tangular design valve and the venturi refers to a circular
pressure drop increases as the velocity increases from “0” style valve.
to point “A.” The pressure drop remains essentially constant as long
The vapor hole velocity at “A” is [201]:
as the liquid flow on tray remains steady during the peri-
od point A to point B on the diagram (the open balance
point) [201]. At point B all valves are completely open off
their seats, but are on the verge of closing and may be
where vpt, A = vapor velocity through holes, closed balance oscillating from open to closed. At point B the vapor veloc-
point, ft/sec ity through the holes, opened balance point is:
T\. = metal thickness of valve, in.
-
\7pt,B =JTVRXJW(CW/KO) (Pvm/Pv),ft/sec (8 312)
E (8- 313)
r Vpt, A /vpt, B = t c
where K, = loss coefficient, valves opened, (sec)2 (in.)/ft2,
7.0 Table 8-23
vps B = vapor velocity through holes, open balance point,
ft/sec
Values of qW, and C, are given in Table 8-22 and pm
in Table 8-24. The closed and open loss coefficients for the
dry tray pressure drop are given in Table 8-23.
Table 8-22
> Coefficients for the Closed and Open Balance Point
2.0
Equations: Equations 8-311 and 8-312
~ ~ ~~~~
1.0 Flat orifice, Venturi orifice,
Valve type Rvw Rvw
0.0 3 legs 1.23 1.29
4 legs 1.34 1.45
Caged (no legs) 1 .oo 1 .oo
~ ~
Figure 8-148. Typical operating valve tray pressure drop profile. (Note: Obtained from measurements on valves)
Valves start to open at A, the closed balance point. Used by permis- & = 1.3 for flat and venturi valves
sion, Klein, G. F. Chem. Eng. V. 89, No. 9 (1982) p. 81; all rights Used by permission, Ch. Eng. Klein, G., May 3 (1982), p. 81; all rights
reserved. reserved.