
Page 373 - Applied Process Design For Chemical And Petrochemical Plants Volume II
P. 373
362 Applied Process Design for Chemical and Petrochemical Plants
are necessary to convert "procedure based" information power of the rate ratio, up to a rate of 500 lb/hr (ft2).
to the specific design basis of a given problem. The cor- Above this rate the increase is reduced, being to the
rections outlined below are specific to the GO2 concen- 0.15 power at rates near 1000 lb/hr (ft2).
tration range being presented in the section.
Because there are not sufficient data to serve complete- 0.35
ly for all types and sizes of packing, it may be necessary to &a a (2) for G = 1 to 500
estimate 9 values by ratioing packing surface areas and
making the other appropriate correction for the problem 0.15
conditions. Kca a (21 for G > 1000
1. Inlet COS concentration, 100 to 1,000 ppm by volume
@: Use Figures 479A-E and Figure 9-80. c. Increases with increase in temperature to the 6.0
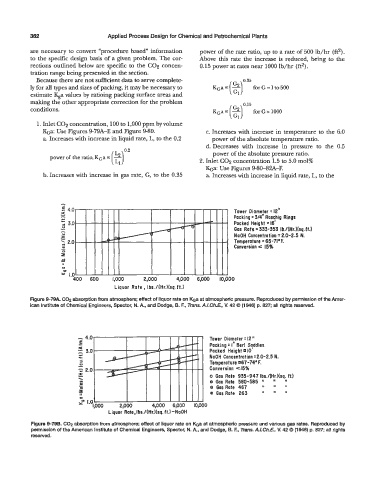
a. Increases with increase in liquid rate, L, to the 0.2 power of the absolute temperature ratio.
d. Decreases with increase in pressure to the 0.5
power of the absolute pressure ratio.
power of the ratio, KGa a (?)O.*
2. Inlet CO2 concentration 1.5 to 5.0 mol%
ka: Use Figures 9-80-8%-F.
b. Increases with increase in gas rate, G, to the 0.35 a. Increases with increase in liquid rate, L, to the
-
- - Tower Diameter = 12"
4.0
i Packing =3/4" Raschig Rings
.c j 3.0 Packed Height = 16'
-
0
I Gas Rate = 333-353 Ib./(Hr.l(sq.ft.)
- NaOH Concentration = 2.0-2.5 N.
L:
r
2 2.0
- Temperature = 65-71.E
Conversion e 15%
al
0
E
9
II
U
y" 1.0
400 600 1,000 2,000 4,000 6,000 l0,OOO
Liquor Rate Ibs./(Hr.)(sq.ft.)
Figure 9-79A. COP absorption from atmosphere; effect of liquor rate on ha at atmospheric pressure. Reproduced by permission of the Amer-
ican Institute of Chemical Engineers, Spector, N. A., and Dodge, B. F., Trans. A.LCh.E, V. 42 0 (1946) p. 827; all rights resewed.
- 4.0 Tower Diameter = 12 'I
E
c Packing = I" Berl Sqddles
U
3.0 Packed Height IO
N.
- NaOH Concentration -2.0-2.5
.c c
5
Tem pe ra t u re 67 -74' F.
V
- Conversion ~15%
z 2.0
I
- I 1 1 e Gas Rate 580-585 I' I' I'
\ o Gas Rate 935-947 Ibs./(Hr.)(sq. ft.)
? I
al
Y)
8 Gas Rate 467
I1
II
II
@
0 )111[1 GasRate 263 'I I' I'
y" 1.0
ltoOO 2,000 4,000 6,000 IOJIOO
Liquor Rate, Ibs./(Hr.)(sq. ft.) -NaOH
Figure 0-798. C02 absorption from atmosphere; effect of liquor rate on Koa at atmosphefic pressure and varSous gas rates. Reproduced by
permission of the American Institute of Chemical Engineers, Spector, N. A, and Dodge, 6. E, Tms. A./.Ch.E. M 42 Q (1946) p. 827; all rights
resewed.