
Page 375 - Applied Process Design For Chemical And Petrochemical Plants Volume II
P. 375
364 Applied Process Design for Chemical and Petrochemical Plants
‘“I
-
(u
0
u 0.6
Y
0- ~~ 1.0 2 .o 3.0 4.0
Sodium Normality
0.2
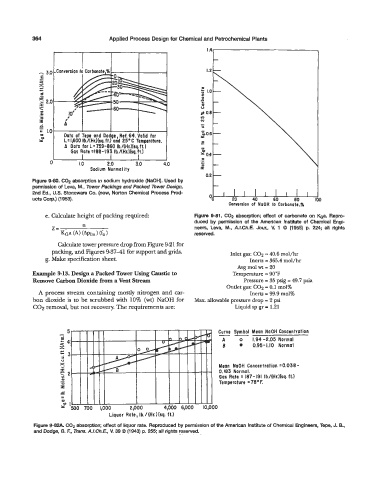
Figure 9-80. C02 absorption in sodium hydroxide (NaOH). Used by
permission of Leva, M., Tower Packings and Packed Tower Design,
2nd Ed., U.S. Stoneware Co. (now, Norton Chemical Process Prod- 40 60 80
ucts Cow.) (1 953). 00 20 9
Conversion of NaOH to Carbonate.%
e. Calculate height of packing required Figure 9-81. GO2 absotption; effect of carbonate on ea. Repro-
duced by permission of the American Institute of Chemical Engi-
n
Z= neers, Leva, M., A.LCh.E. Jour., V. 1 0 (1955) p. 224; all rights
KGa (A) (hn (fa reserved.
Calculate tower pressure drop from Figure 9-21 for
packing, and Figures 9-37-41 for support and grids. Inlet gas: COS = 40.6 mol/hr
g. Make specification sheet. Inerts = 365.4 mol/hr
Avg mol wt = 20
Example 9-13. Design a Packed Tower Using Caustic to Temperature = 90°F
Remove Carbon Dioxide from a Vent Stream Pressure = 35 psig = 49.7 psia
Outlet gas: CO2 = 0.1 mol%
A process stream containing mostly nitrogen and car- Inerts = 99.9 mol%
bon dioxide is to be scrubbed with 10% (wt) NaOH for Max. allowable pressure drop = 2 psi
C02 removal, but not recovery. The requirements are: Liquid sp gr = 1.21
--
Curve Symbol Mean NaOH Concentration
A o 1.94-2.05 Normal
B 0 0.95-1.10 Normal
Mean NaOH Concentration ~0.038-
0.183 Normal.
- Gas Rate = 187-191 Ib./(Hr.l(sq. ft.1
a,
Temperature =78OE
0
z
e
II
4,000 6,000 10,000
Liquor Rate, Ib./(Hr.)(sq. ft.)
Figure 9-82A. COP absorption; effect of liquor rate. Reproduced by permission of the American Institute of Chemical Engineers, Tepe, J. B.,
and Dodge, B. E, Trans. A.LCh.f., V. 39 Q (1943) p. 255; all rights resewed.