
Page 374 - Applied Process Design For Chemical And Petrochemical Plants Volume II
P. 374
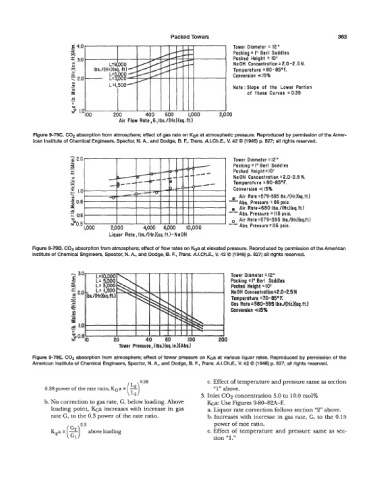
Packed Towers                                           363
                         Ei
                         e 4.0                                                 Tower  Diameter = 12”
                         s                                                     Packing = I“  Berl Saddles
                         5 3.0                                                 Pocked  Height =  IO’
                         -                                                     NaOH  Concentrotion 5 2.0  -2.5  N.
                         -
                         0
                         &                                                     Temperature  ~80-85OF.
                         I
                         Y 2.0                                                 Conversion (15%
                         -                                                     Note: Slope  of  the  Lower  Portion
                         II)
                         el
                         0
                         3                                                         of  these  Curves  = 0.35
                         “i
                         I1
                         0
                         2 1.0
                              100      200        400   600     1,000     2poo
                                         Air  Flow Rate lG,Ibs./(Hr.)(sq.ft.)
            Figure 9-79C. Cop absorption from atmosphere; effect of gas rate on %a  at atmospheric pressure. Reproduced by permission of the Amer-
            ican Institute of Chemical Engineers, Spector, N. A.,  and Dodge, B. F., Trans. A.bCh.E, V. 42 0 (1946) p. 827; all rights reserved.
                         2 2.0                                                 Tower  Diameter =12”
                         s                                                     Packing =  Berl Saddles
                         2                                                     Packed  Height = IO’
                         u -                                                   NaOH Concentration =2.0-2.5  N.
                         L
                         a
                         0
                                                                               Temperature = 80 -85’F.
                         L’                                                    Conversion < 15%
                         5 1.0
                         In
                         \                                                       Air Rate =579-595 Ibs./(Hr.)(sq.ft.)
                         V  0.8                                              -Ab%    Pressure = 66psia.
                         s                                                    e  Air  Rate=680 Ibs./(Hr.)(sq.ft.)
                         0‘                        1   I  IIIII              --Abs.   Pressure = 116 psia.
                         II  0.6
                         0                                                       Air Rate=579-595  Ibs./(Hr)(sq.tt.l
                         20.5                                                    Abs.  Pressure= 116  psia.
                             1,000    2,000      4,000   6,000   10,000      -*-
                                      Liquor  Rate ,Ibs./(Hr.)(sq,ft.)-NaOH
            Figure 9-79D. Cop absorption from atmosphere; effect of flow rates on Koa at elevated pressure. Reproduced by permission of the American
            Institute  of Chemical Engineers, Spector, N. A.,  and Dodge, B. F.,  Trans. A./.Ch.€., V.  42 0 (1 946) p. 827; all rights reserved.
                                                                              Tower Diameter = 12”
                                                                              Packing =I“ Berl  Saddles
                                                                              Pocked Height =IO‘
                                                                              NaOH Concentration=2.0-2.5  N
                                                                              Temperature =70-85O F.
                                                                              Gas Rate =580-595 Ibs.l(Hd(sq.ft.1
                                                                              Conversion 45%


                                         Tower  Pressure, (lbs,)(sq.  in.l(Abs.1

            Figure 9-79E. C02 absorption from atmosphere; effect of tower pressure on &a  at various liquor rates. Reproduced by permission of the
            American Institute  of Chemical Engineers, Spector, N. A, and Dodge, 6. F., Ti. A/.Ch.E., V.  42 0 (1946) p.  827; all rights reserved.


                                                                      c. Effect of temperature and pressure same as section
                0.28 power of the rate ratio, KGa 0~  -                 “1” above.
                                            ( ;)o.28                3. Inlet CO2 concentration 5.0 to 10.0 mol%
                b. No correction to gas rate, G, below loading. Above   ka: Use Figures 9-80-82A-F.
                  loading point,    increases with  increase in gas   a. Liquor rate correction follows section “2” above.
                  rate G, to the 0.3 power of the rate ratio.         b. Increases with increase in gas  rate, G, to the 0.15
                            0.3                                         power of rate ratio.
                               above loading                          c. Effect of temperature and pressure same as sec-
                                                                        tion “1.”