
Page 77 - Applied Process Design For Chemical And Petrochemical Plants Volume II
P. 77
66 Applied Process Design for Chemical and Petrochemical Plants
Dklper.)
D(Min.1
D
=.995
tual Reflux Ratio (LID)
See Calculations for Coafinuotion
of Tray Count. Graphical Accuracy
Stops at Tray No.6.
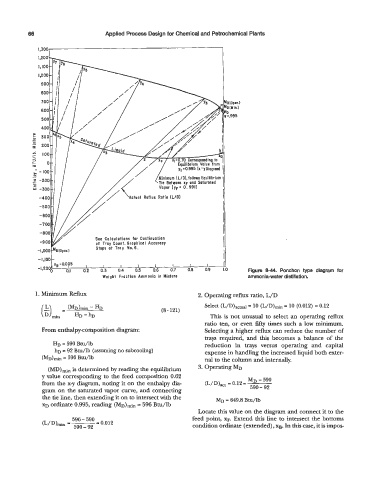
Flgure 8-44. Ponchon type diagram for
Weight Fraction Ammonia in Mixfure amrnonla-water distillation.
1. Minimum Reflux 2. Operating reflux ratio, L/D
Select (L/D)=-l= 10 (L/D),i, = 10 (0.012) = 0.12
(8- 121)
This is not unusual to select an operating reflux
ratio ten, or even fifty times such a low minimum.
From enthalpycomposition diagram: Selecting a higher reflux can reduce the number of
trays required, and this becomes a balance of the
HD = 590 Btu/lb reduction in trays versus operating and capital
hD = 92 Btu/lb (assuming no subcooling) expense in handling the increased liquid both exter-
(MD),~, = 396 Btu/lb nal to the column and internally.
(MD),in is determined by reading the equilibrium 3. Operating MD
y value corresponding to the feed composition 0.62 MD - 590
from the x-y diagram, noting it on the enthalpy dia- (L/D),, = 0.12 =
gram on the saturated vapor curve, and connecting 590 - 92
the tie line, then extending it on to intersect with the MD = 649.8 Btu/lb
XD ordinate 0.995, reading (MD)~~~ Btu/lb
596
=
Locate this value on the diagram and connect it to the
feed point, XF. Extend this line to intersect the bottoms
condition ordinate (extended), XB. In this case, it is impos-