
Page 75 - Applied Process Design For Chemical And Petrochemical Plants Volume II
P. 75
64 Applied Process Design for Chemical and Petrochemical Plants
Superheated Vopor I D 1 .. .. ..
Region II
I
I
I
I
f ,
f Sub-Cooled Liquid
Region
Note: x and y ore Corresponding
Equilibrium Liquid and Vopor
Values Obtained from x-y Diagram.
I I
I I :XL IxF!YV
Mol or Weigth Fraction pf One 0 1 .o
Component in Liquid or Vapor Mol or Weight Fraction of One
Component in Liquid or Vopor
I I
B Note:yn: x,+I E
Troy No.
I
I I
I 1 I
I I I
XB ; XF pD
I 3
Mol or Weight Fraclion of One U
Component in Liquid or Vopor Mol Weight Froction of One
Componeat in Liquid or Vopor
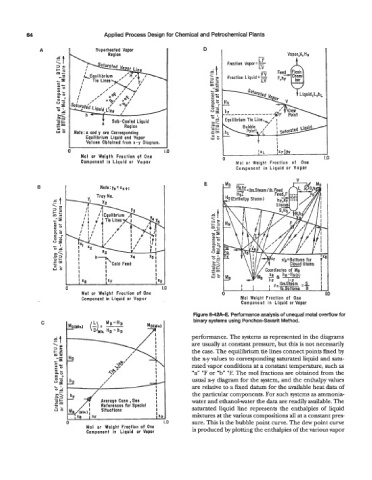
Figure 8-42R-E. Performance analysls of unequal molal overflow for
C binary systems using Ponchon-Savarit Method.
performance. The systems as represented in the diagrams
are usually at constant pressure, but this is not necessarily
the case. The equilibrium tie lines connect points fixed by
the x-y values to corresponding saturated liquid and satu-
rated vapor conditions at a constant temperature, such as
“a” “F or “b” OF. The mol fractions are obtained from the
usual x-y diagram for the system, and the enthalpy values
are relative to a fixed datum for the available heat data of
I the particular components. For such systems as ammonia-
water and ethanol-water the data are readily available. The
saturated liquid line represents the enthalpies of liquid
mixtures at the various compositions all at a constant pres-
) 1.0 sure. This is the bubble point curve. The dew point curve
Mol or Weight Fraction of One is produced by plotting the enthalpies of the various vapor
Component in Liquid or Vapor