
Page 78 - Applied Process Design For Chemical And Petrochemical Plants Volume II
P. 78
Distillation 67
sible to represent the value, x = 0.005, accurately but con-
struct it as close as possible to the required condition. MB
is now located. Improvement of this accuracy will be
shown later in the problem.
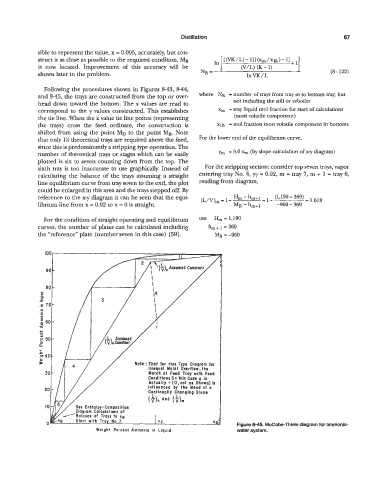
Following the procedures shown in Figures 8-43, 8-44,
and 8-45, the trays are constructed from the top or over- where NB = number of uays from tray m to bottom tray, but
head down toward the bottom. The x values are read to not including the still or reboiler
correspond to the y values constructed. This establishes x, = tray liquid mol fraction for start of calculations
the tie line. When the x value tie line points (representing (most volatile component)
the trays) cross the feed ordinate, the construction is XIB = mol fraction most volatile component in bottoms
shifted from using the point MI, to the point MB. Note
that only 1% theoretical trays are required above the feed, For the lower end of the equilibrium curve,
since this is predominantly a stripping type operation. The
number of theoretical trays or stages which can be easily ym = 5.0 x, (by slope calculation of x-y diagram)
plotted is six to seven counting down from the top. The
sixth tray is too inaccurate to use graphically. Instead of For the stripping section: consider top seven trays, vapor
calculating the balance of the trays assuming a straight entering tray No. 6, y7 = 0.02, m = tray 7, m + 1 = tray 6,
line equilibrium curve from tray seven to the end, the plot reading from diagram,
could be enlarged in this area and the trays stepped off. By
reference to the x-y diagram it can be seen that the equi-
librium line from x = 0.02 to x = 0 is straight.
For the condition of straight operating and equilibrium use H, = 1,190
curves, the number of plates can be calculated including hm+l =369
the “reference” plate (number seven in this case) [59]. MB = -960
-
90
Nofe : That for this Type Diagram for
Unequal Molal Overflow, the
Match at Feed Tray with Feed
Conditions (in fhis Case q is
Actually = 1.0, not as Shown) is
Influenced by the Need of a
Continually Changing Slope
(Ti.)” and (b)m
L
XD Figure 8-46. McCabe-Thiele diagram for ammonia-
Weight Percent Ammonia in Liquid water system.