Page 197 - Applied Statistics And Probability For Engineers
P. 197

c05.qxd  5/13/02  1:50 PM  Page 173 RK UL 6 RK UL 6:Desktop Folder:TEMP WORK:MONTGOMERY:REVISES UPLO D CH114 FIN L:Quark Files:


                                                                        5-5 COVARIANCE AND CORRELATION    173


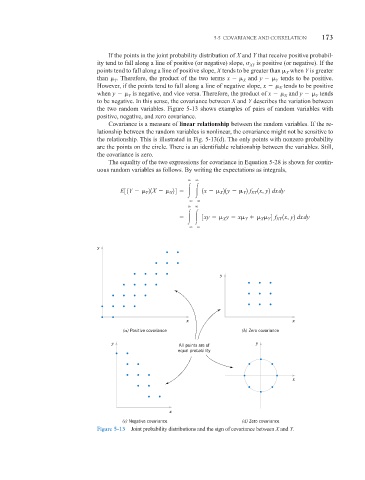
                                       If the points in the joint probability distribution of X and Y that receive positive probabil-
                                   ity tend to fall along a line of positive (or negative) slope,   XY is positive (or negative). If the
                                   points tend to fall along a line of positive slope, X tends to be greater than   when Y is greater
                                                                                               X
                                   than   . Therefore, the product of the two terms x    and y    tends to be positive.
                                                                                            Y
                                                                                 X
                                         Y
                                   However, if the points tend to fall along a line of negative slope, x    X tends to be positive
                                   when y    Y is negative, and vice versa. Therefore, the product of x    X and y    Y tends
                                   to be negative. In this sense, the covariance between X and Y describes the variation between
                                   the two random variables. Figure 5-13 shows examples of pairs of random variables with
                                   positive, negative, and zero covariance.
                                       Covariance is a measure of linear relationship between the random variables. If the re-
                                   lationship between the random variables is nonlinear, the covariance might not be sensitive to
                                   the relationship. This is illustrated in Fig. 5-13(d). The only points with nonzero probability
                                   are the points on the circle. There is an identifiable relationship between the variables. Still,
                                   the covariance is zero.
                                       The equality of the two expressions for covariance in Equation 5-28 is shown for contin-
                                   uous random variables as follows. By writing the expectations as integrals,

                                          E31Y    21X    24          1x    21y    2  f   1x, y2 dx dy

                                                                          X
                                                                                 Y   XY
                                                  Y
                                                          X


                                                                       3xy    y   x       4    f XY  1x, y2 dx dy
                                                                                  Y
                                                                                       X Y
                                                                           X

                                   y

                                                                          y


                                                               x                                 x
                                           (a) Positive covariance               (b) Zero covariance
                                        y                                            y
                                                             All points are of
                                                             equal probability


                                                                                                 x


                                                          x
                                           (c) Negative covariance               (d) Zero covariance
                                   Figure 5-13  Joint probability distributions and the sign of covariance between X and Y.
   192   193   194   195   196   197   198   199   200   201   202