
Page 30 - Applied Statistics And Probability For Engineers
P. 30
PQ220 6234F.CD(01) 5/9/02 1:28 PM Page 1 RK UL 6 RK UL 6:Desktop Folder:TEMP WORK:MONTGOMERY:REVISES UPLO D CH112 FIN L:
1-2.5 A Factorial Experiment for the Connector Pull-off Force Problem
(CD only)
Much of what we know in the engineering and physical-chemical sciences is developed
through testing or experimentation. Often engineers work in problem areas in which no
scientific or engineering theory is directly or completely applicable, so experimentation
and observation of the resulting data constitute the only way that the problem can be
solved. Even when there is a good underlying scientific theory that we may rely on to
explain the phenomena of interest, it is almost always necessary to conduct tests or exper-
iments to confirm that the theory is indeed operative in the situation or environment in
which it is being applied. We have observed that statistical thinking and statistical methods
play an important role in planning, conducting, and analyzing the data from engineering
experiments.
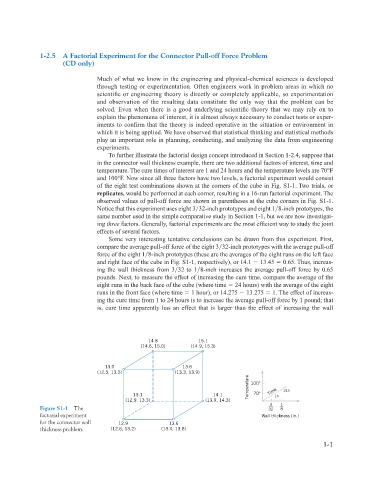
To further illustrate the factorial design concept introduced in Section 1-2.4, suppose that
in the connector wall thickness example, there are two additional factors of interest, time and
temperature. The cure times of interest are 1 and 24 hours and the temperature levels are 70°F
and 100°F. Now since all three factors have two levels, a factorial experiment would consist
of the eight test combinations shown at the corners of the cube in Fig. S1-1. Two trials, or
replicates, would be performed at each corner, resulting in a 16-run factorial experiment. The
observed values of pull-off force are shown in parentheses at the cube corners in Fig. S1-1.
Notice that this experiment uses eight 3 32-inch prototypes and eight 1 8-inch prototypes, the
same number used in the simple comparative study in Section 1-1, but we are now investigat-
ing three factors. Generally, factorial experiments are the most efficient way to study the joint
effects of several factors.
Some very interesting tentative conclusions can be drawn from this experiment. First,
compare the average pull-off force of the eight 3 32-inch prototypes with the average pull-off
force of the eight 1 8-inch prototypes (these are the averages of the eight runs on the left face
and right face of the cube in Fig. S1-1, respectively), or 14.1 13.45 0.65. Thus, increas-
ing the wall thickness from 3 32 to 1 8-inch increases the average pull-off force by 0.65
pounds. Next, to measure the effect of increasing the cure time, compare the average of the
eight runs in the back face of the cube (where time 24 hours) with the average of the eight
runs in the front face (where time 1 hour), or 14.275 13.275 1. The effect of increas-
ing the cure time from 1 to 24 hours is to increase the average pull-off force by 1 pound; that
is, cure time apparently has an effect that is larger than the effect of increasing the wall
14.8 15.1
(14.6, 15.0) (14.9, 15.3)
13.0 13.6
(12.5, 13.5) (13.3, 13.9)
Temperature 100 ˚ 24h
13.1 14.1 70 ˚ Time 1h
(12.9, 13.3) (13.9, 14.3)
3 1
Figure S1-1 The 32 8
factorial experiment Wall thickness (in.)
for the connector wall 12.9 13.6
thickness problem. (12.6, 13.2) (13.4, 13.8)
1-1