
Page 27 - Applied Statistics And Probability For Engineers
P. 27
c01.qxd 5/22/02 11:15 M Page 13 RK UL 6 RK UL 6:Desktop Folder:TOD Y {22/5/2002} CH 1to3:
1-3 MECHANISTIC AND EMPIRICAL MODELS 13
80
Pull strength 60 40
600
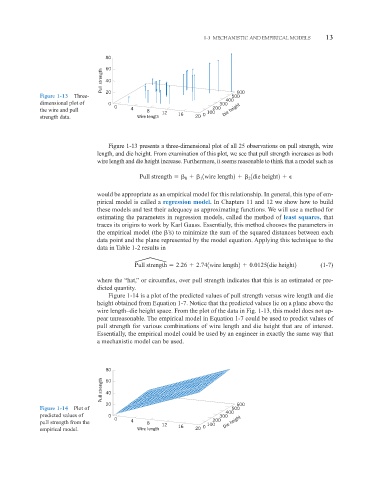
Figure 1-13 Three- 20 500
400
dimensional plot of 0 300
0 200
the wire and pull 4 8 Die height
12 16 0 100
strength data. Wire length 20
Figure 1-13 presents a three-dimensional plot of all 25 observations on pull strength, wire
length, and die height. From examination of this plot, we see that pull strength increases as both
wire length and die height increase. Furthermore, it seems reasonable to think that a model such as
1wire length2 1die height2
Pull strength 0 1 2
would be appropriate as an empirical model for this relationship. In general, this type of em-
pirical model is called a regression model. In Chapters 11 and 12 we show how to build
these models and test their adequacy as approximating functions. We will use a method for
estimating the parameters in regression models, called the method of least squares, that
traces its origins to work by Karl Gauss. Essentially, this method chooses the parameters in
the empirical model (the ’s) to minimize the sum of the squared distances between each
data point and the plane represented by the model equation. Applying this technique to the
data in Table 1-2 results in
π
Pull strength 2.26 2.741wire length2 0.01251die height2 (1-7)
where the “hat,” or circumflex, over pull strength indicates that this is an estimated or pre-
dicted quantity.
Figure 1-14 is a plot of the predicted values of pull strength versus wire length and die
height obtained from Equation 1-7. Notice that the predicted values lie on a plane above the
wire length–die height space. From the plot of the data in Fig. 1-13, this model does not ap-
pear unreasonable. The empirical model in Equation 1-7 could be used to predict values of
pull strength for various combinations of wire length and die height that are of interest.
Essentially, the empirical model could be used by an engineer in exactly the same way that
a mechanistic model can be used.
80
Pull strength 60
40
20 600
Figure 1-14 Plot of 500
400
predicted values of 0 300
0 200
pull strength from the 4 8 12 100 Die height
empirical model. Wire length 16 20 0