
Page 22 - Applied Statistics And Probability For Engineers
P. 22
c01.qxd 5/9/02 1:28 PM Page 8 RK UL 6 RK UL 6:Desktop Folder:TEMP WORK:MONTGOMERY:REVISES UPLO D CH112 FIN L:
8 CHAPTER 1 THE ROLE OF STATISTICS IN ENGINEERING
Reflux rate +1 Condensate +1
temperature
–1
Figure 1-6 The fac- –1
torial design for the –1 +1
Reboil temperature
distillation column.
1-2.5 A Factorial Experiment for the Connector Pull-off
Force Problem (CD Only)
1-2.6 Observing Processes Over Time
Often data are collected over time. In this case, it is usually very helpful to plot the data ver-
sus time in a time series plot. Phenomena that might affect the system or process often be-
come more visible in a time-oriented plot and the concept of stability can be better judged.
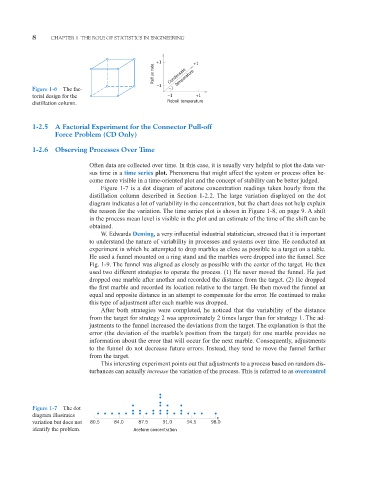
Figure 1-7 is a dot diagram of acetone concentration readings taken hourly from the
distillation column described in Section 1-2.2. The large variation displayed on the dot
diagram indicates a lot of variability in the concentration, but the chart does not help explain
the reason for the variation. The time series plot is shown in Figure 1-8, on page 9. A shift
in the process mean level is visible in the plot and an estimate of the time of the shift can be
obtained.
W. Edwards Deming, a very influential industrial statistician, stressed that it is important
to understand the nature of variability in processes and systems over time. He conducted an
experiment in which he attempted to drop marbles as close as possible to a target on a table.
He used a funnel mounted on a ring stand and the marbles were dropped into the funnel. See
Fig. 1-9. The funnel was aligned as closely as possible with the center of the target. He then
used two different strategies to operate the process. (1) He never moved the funnel. He just
dropped one marble after another and recorded the distance from the target. (2) He dropped
the first marble and recorded its location relative to the target. He then moved the funnel an
equal and opposite distance in an attempt to compensate for the error. He continued to make
this type of adjustment after each marble was dropped.
After both strategies were completed, he noticed that the variability of the distance
from the target for strategy 2 was approximately 2 times larger than for strategy 1. The ad-
justments to the funnel increased the deviations from the target. The explanation is that the
error (the deviation of the marble’s position from the target) for one marble provides no
information about the error that will occur for the next marble. Consequently, adjustments
to the funnel do not decrease future errors. Instead, they tend to move the funnel farther
from the target.
This interesting experiment points out that adjustments to a process based on random dis-
turbances can actually increase the variation of the process. This is referred to as overcontrol
Figure 1-7 The dot
diagram illustrates
x
variation but does not 80.5 84.0 87.5 91.0 94.5 98.0
identify the problem. Acetone concentration