
Page 23 - Applied Statistics And Probability For Engineers
P. 23
c01.qxd 5/9/02 1:28 PM Page 9 RK UL 6 RK UL 6:Desktop Folder:TEMP WORK:MONTGOMERY:REVISES UPLO D CH112 FIN L:
1-2 COLLECTING ENGINEERING DATA 9
100
Acetone concentration 90
80
10 20 30
Observation number (hour) Target Marbles
Figure 1-8 A time series plot of concentration provides Figure 1-9 Deming’s funnel experiment.
more information than the dot diagram.
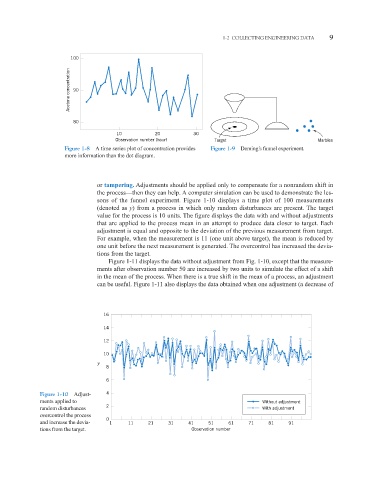
or tampering. Adjustments should be applied only to compensate for a nonrandom shift in
the process—then they can help. A computer simulation can be used to demonstrate the les-
sons of the funnel experiment. Figure 1-10 displays a time plot of 100 measurements
(denoted as y) from a process in which only random disturbances are present. The target
value for the process is 10 units. The figure displays the data with and without adjustments
that are applied to the process mean in an attempt to produce data closer to target. Each
adjustment is equal and opposite to the deviation of the previous measurement from target.
For example, when the measurement is 11 (one unit above target), the mean is reduced by
one unit before the next measurement is generated. The overcontrol has increased the devia-
tions from the target.
Figure 1-11 displays the data without adjustment from Fig. 1-10, except that the measure-
ments after observation number 50 are increased by two units to simulate the effect of a shift
in the mean of the process. When there is a true shift in the mean of a process, an adjustment
can be useful. Figure 1-11 also displays the data obtained when one adjustment (a decrease of
16
14
12
10
y
8
6
Figure 1-10 Adjust- 4
ments applied to Without adjustment
2
random disturbances With adjustment
overcontrol the process
0
and increase the devia- 1 11 21 31 41 51 61 71 81 91
tions from the target. Observation number