
Page 24 - Applied Statistics And Probability For Engineers
P. 24
c01.qxd 5/10/02 10:15 M Page 10 RK UL 6 RK UL 6:Desktop Folder:TEMP WORK:MONTGOMERY:REVISES UPLO D CH114 FIN L:
10 CHAPTER 1 THE ROLE OF STATISTICS IN ENGINEERING
16
Process mean shift
14 is detected.
12
10
y
8
6
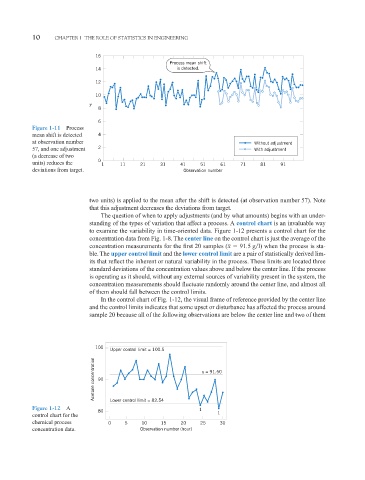
Figure 1-11 Process
mean shift is detected 4
at observation number Without adjustment
57, and one adjustment 2 With adjustment
(a decrease of two
0
units) reduces the 1 11 21 31 41 51 61 71 81 91
deviations from target. Observation number
two units) is applied to the mean after the shift is detected (at observation number 57). Note
that this adjustment decreases the deviations from target.
The question of when to apply adjustments (and by what amounts) begins with an under-
standing of the types of variation that affect a process. A control chart is an invaluable way
to examine the variability in time-oriented data. Figure 1-12 presents a control chart for the
concentration data from Fig. 1-8. The center line on the control chart is just the average of the
concentration measurements for the first 20 samples (x 91.5 g l ) when the process is sta-
ble. The upper control limit and the lower control limit are a pair of statistically derived lim-
its that reflect the inherent or natural variability in the process. These limits are located three
standard deviations of the concentration values above and below the center line. If the process
is operating as it should, without any external sources of variability present in the system, the
concentration measurements should fluctuate randomly around the center line, and almost all
of them should fall between the control limits.
In the control chart of Fig. 1-12, the visual frame of reference provided by the center line
and the control limits indicates that some upset or disturbance has affected the process around
sample 20 because all of the following observations are below the center line and two of them
100
Upper control limit = 100.5
Acetone concentration 90 x = 91.50
Figure 1-12 A Lower control limit = 82.54 1
80 1
control chart for the
chemical process 0 5 10 15 20 25 30
concentration data. Observation number (hour)