
Page 18 - Applied Statistics And Probability For Engineers
P. 18
c01.qxd 5/9/02 1:28 PM Page 4 RK UL 6 RK UL 6:Desktop Folder:TEMP WORK:MONTGOMERY:REVISES UPLO D CH112 FIN L:
4 CHAPTER 1 THE ROLE OF STATISTICS IN ENGINEERING
intended application, so he decides to consider an alternative design with a greater wall
thickness, 1 8 inch. Eight prototypes of this design are built, and the observed pull-off force
measurements are 12.9, 13.7, 12.8, 13.9, 14.2, 13.2, 13.5, and 13.1. The average is 13.4.
Results for both samples are plotted as dot diagrams in Fig. 1-3, page 3. This display gives
the impression that increasing the wall thickness has led to an increase in pull-off force.
However, there are some obvious questions to ask. For instance, how do we know that an-
other sample of prototypes will not give different results? Is a sample of eight prototypes
adequate to give reliable results? If we use the test results obtained so far to conclude that
increasing the wall thickness increases the strength, what risks are associated with this de-
cision? For example, is it possible that the apparent increase in pull-off force observed in
the thicker prototypes is only due to the inherent variability in the system and that increas-
ing the thickness of the part (and its cost) really has no effect on the pull-off force?
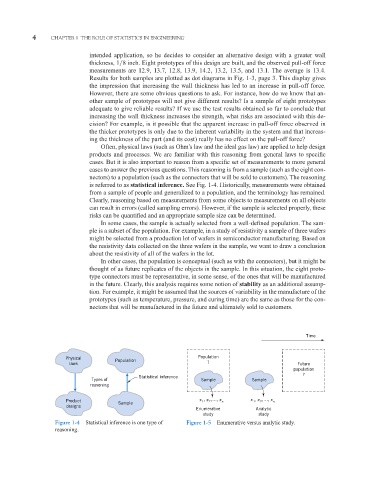
Often, physical laws (such as Ohm’s law and the ideal gas law) are applied to help design
products and processes. We are familiar with this reasoning from general laws to specific
cases. But it is also important to reason from a specific set of measurements to more general
cases to answer the previous questions. This reasoning is from a sample (such as the eight con-
nectors) to a population (such as the connectors that will be sold to customers). The reasoning
is referred to as statistical inference. See Fig. 1-4. Historically, measurements were obtained
from a sample of people and generalized to a population, and the terminology has remained.
Clearly, reasoning based on measurements from some objects to measurements on all objects
can result in errors (called sampling errors). However, if the sample is selected properly, these
risks can be quantified and an appropriate sample size can be determined.
In some cases, the sample is actually selected from a well-defined population. The sam-
ple is a subset of the population. For example, in a study of resistivity a sample of three wafers
might be selected from a production lot of wafers in semiconductor manufacturing. Based on
the resistivity data collected on the three wafers in the sample, we want to draw a conclusion
about the resistivity of all of the wafers in the lot.
In other cases, the population is conceptual (such as with the connectors), but it might be
thought of as future replicates of the objects in the sample. In this situation, the eight proto-
type connectors must be representative, in some sense, of the ones that will be manufactured
in the future. Clearly, this analysis requires some notion of stability as an additional assump-
tion. For example, it might be assumed that the sources of variability in the manufacture of the
prototypes (such as temperature, pressure, and curing time) are the same as those for the con-
nectors that will be manufactured in the future and ultimately sold to customers.
Time
Population
Physical Population
laws ? Future
population
?
Statistical inference
Types of Sample Sample
reasoning
Product Sample x , x ,…, x x , x ,…, x
1
n
n
2
1
2
designs
Enumerative Analytic
study study
Figure 1-4 Statistical inference is one type of Figure 1-5 Enumerative versus analytic study.
reasoning.