
Page 31 - Applied Statistics And Probability For Engineers
P. 31
PQ220 6234F.CD(01) 5/9/02 1:28 PM Page 2 RK UL 6 RK UL 6:Desktop Folder:TEMP WORK:MONTGOMERY:REVISES UPLO D CH112 FIN L:
1-2
Time Temp. Avg. Force
15.30
1 h 70 F 13.25 Temp. = 100 F
˚
˚
˚
1 h 100 F 13.30
24 h 70 ˚ F 13.60 14.83
24 h 100 ˚ F 14.95
14.37
Pounds 13.90 Temp. = 100 F Temp. = 70 ˚ F
˚
13.43
Temp. = 70 F
˚
12.97
12.50
1 h 24 h
Time
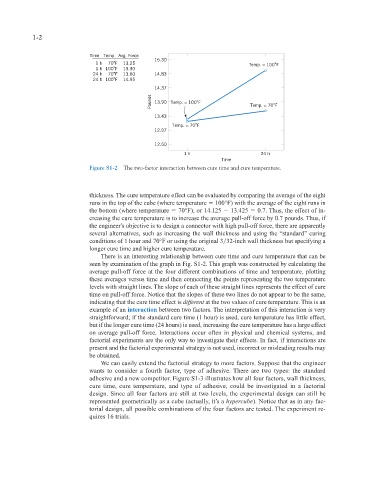
Figure S1-2 The two-factor interaction between cure time and cure temperature.
thickness. The cure temperature effect can be evaluated by comparing the average of the eight
runs in the top of the cube (where temperature 100°F) with the average of the eight runs in
the bottom (where temperature 70°F), or 14.125 13.425 0.7. Thus, the effect of in-
creasing the cure temperature is to increase the average pull-off force by 0.7 pounds. Thus, if
the engineer’s objective is to design a connector with high pull-off force, there are apparently
several alternatives, such as increasing the wall thickness and using the “standard’’ curing
conditions of 1 hour and 70°F or using the original 3 32-inch wall thickness but specifying a
longer cure time and higher cure temperature.
There is an interesting relationship between cure time and cure temperature that can be
seen by examination of the graph in Fig. S1-2. This graph was constructed by calculating the
average pull-off force at the four different combinations of time and temperature, plotting
these averages versus time and then connecting the points representing the two temperature
levels with straight lines. The slope of each of these straight lines represents the effect of cure
time on pull-off force. Notice that the slopes of these two lines do not appear to be the same,
indicating that the cure time effect is different at the two values of cure temperature. This is an
example of an interaction between two factors. The interpretation of this interaction is very
straightforward; if the standard cure time (1 hour) is used, cure temperature has little effect,
but if the longer cure time (24 hours) is used, increasing the cure temperature has a large effect
on average pull-off force. Interactions occur often in physical and chemical systems, and
factorial experiments are the only way to investigate their effects. In fact, if interactions are
present and the factorial experimental strategy is not used, incorrect or misleading results may
be obtained.
We can easily extend the factorial strategy to more factors. Suppose that the engineer
wants to consider a fourth factor, type of adhesive. There are two types: the standard
adhesive and a new competitor. Figure S1-3 illustrates how all four factors, wall thickness,
cure time, cure temperature, and type of adhesive, could be investigated in a factorial
design. Since all four factors are still at two levels, the experimental design can still be
represented geometrically as a cube (actually, it’s a hypercube). Notice that as in any fac-
torial design, all possible combinations of the four factors are tested. The experiment re-
quires 16 trials.