
Page 34 - Applied Statistics And Probability For Engineers
P. 34
c02.qxd 5/10/02 1:06 PM Page 17 RK UL 6 RK UL 6:Desktop Folder:TEMP WORK:MONTGOMERY:REVISES UPLO D CH114 FIN L:Quark Files:
2-1 SAMPLE SPACES AND EVENTS 17
Answers for most odd numbered exercises are at the end of the book. Answers to exercises whose
numbers are surrounded by a box can be accessed in the e-Text by clicking on the box. Complete
worked solutions to certain exercises are also available in the e-Text. These are indicated in the
Answers to Selected Exercises section by a box around the exercise number. Exercises are also
available for some of the text sections that appear on CD only. These exercises may be found within
the e-Text immediately following the section they accompany.
2-1 SAMPLE SPACES AND EVENTS
2-1.1 Random Experiments
If we measure the current in a thin copper wire, we are conducting an experiment. However,
in day-to-day repetitions of the measurement the results can differ slightly because of small
variations in variables that are not controlled in our experiment, including changes in ambient
temperatures, slight variations in gauge and small impurities in the chemical composition of
the wire if different locations are selected, and current source drifts. Consequently, this exper-
iment (as well as many we conduct) is said to have a random component. In some cases,
the random variations, are small enough, relative to our experimental goals, that they can be
ignored. However, no matter how carefully our experiment is designed and conducted, the
variation is almost always present, and its magnitude can be large enough that the important
conclusions from our experiment are not obvious. In these cases, the methods presented in this
book for modeling and analyzing experimental results are quite valuable.
Our goal is to understand, quantify, and model the type of variations that we often
encounter. When we incorporate the variation into our thinking and analyses, we can make
informed judgments from our results that are not invalidated by the variation.
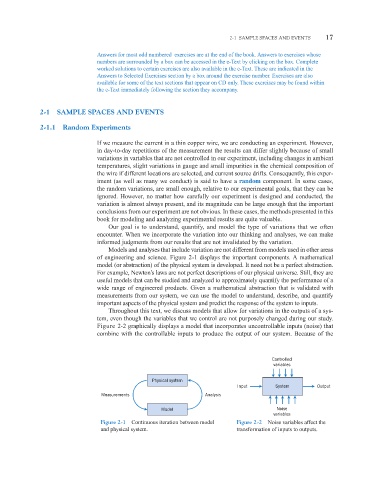
Models and analyses that include variation are not different from models used in other areas
of engineering and science. Figure 2-1 displays the important components. A mathematical
model (or abstraction) of the physical system is developed. It need not be a perfect abstraction.
For example, Newton’s laws are not perfect descriptions of our physical universe. Still, they are
useful models that can be studied and analyzed to approximately quantify the performance of a
wide range of engineered products. Given a mathematical abstraction that is validated with
measurements from our system, we can use the model to understand, describe, and quantify
important aspects of the physical system and predict the response of the system to inputs.
Throughout this text, we discuss models that allow for variations in the outputs of a sys-
tem, even though the variables that we control are not purposely changed during our study.
Figure 2-2 graphically displays a model that incorporates uncontrollable inputs (noise) that
combine with the controllable inputs to produce the output of our system. Because of the
Controlled
variables
Physical system
Input System Output
Measurements Analysis
Model Noise
variables
Figure 2-1 Continuous iteration between model Figure 2-2 Noise variables affect the
and physical system. transformation of inputs to outputs.