
Page 386 - Applied Statistics And Probability For Engineers
P. 386
c10.qxd 5/16/02 1:30 PM Page 330 RK UL 6 RK UL 6:Desktop Folder:TEMP WORK:MONTGOMERY:REVISES UPLO D CH114 FIN L:Quark Files:
330 CHAPTER 10 STATISTICAL INFERENCE FOR TWO SAMPLES
as the boundaries of the critical re-
0 and z
2
distribution when H is true, we would take z
2
gion just as we did in the single-sample hypothesis-testing problem of Section 9-2.1. This
would give a test with level of significance . Critical regions for the one-sided alternatives
would be located similarly. Formally, we summarize these results below.
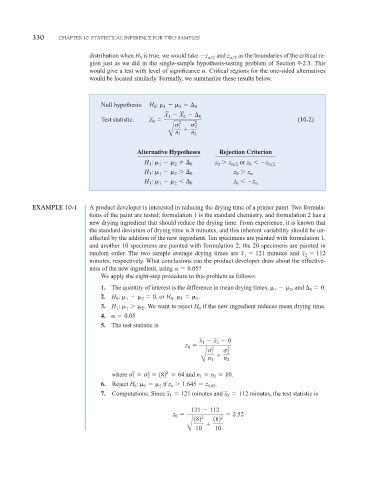
Null hypothesis: H : 0
0
2
1
X X 0
1
2
Test statistic: Z 2 2 (10-2)
0
1 2
n n
B 1 2
Alternative Hypotheses Rejection Criterion
H˛ 1 : 1 2 0 z 0
z
2 or z 0 z
2
H˛ :
0 z
z
1
0
2
1
H˛ : 0 z z
1
1
2
0
EXAMPLE 10-1 A product developer is interested in reducing the drying time of a primer paint. Two formula-
tions of the paint are tested; formulation 1 is the standard chemistry, and formulation 2 has a
new drying ingredient that should reduce the drying time. From experience, it is known that
the standard deviation of drying time is 8 minutes, and this inherent variability should be un-
affected by the addition of the new ingredient. Ten specimens are painted with formulation 1,
and another 10 specimens are painted with formulation 2; the 20 specimens are painted in
random order. The two sample average drying times are x˛ 121 minutes and x˛ 112
2
1
minutes, respectively. What conclusions can the product developer draw about the effective-
ness of the new ingredient, using 0.05?
We apply the eight-step procedure to this problem as follows:
1. The quantity of interest is the difference in mean drying times, , and 0.
0
1
2
2. H˛ : 0, or H˛ :˛ .
0
2
1
1
0
2
3. H˛ 1 : 1
2 . We want to reject H if the new ingredient reduces mean drying time.
0
4. 0.05
5. The test statistic is
x x 0
2
1
z˛ 2 2
0
1 2
n n
B 1 2
2
2
where 1 2 182 2 64 and n 1 n 2 10.
6. Reject H 0 : 1 2 if z 0
1.645 z 0.05 .
7. Computations: Since x 121 minutes and x 112 minutes, the test statistic is
1
2
121 112
2.52
z 0 2 2
182 182
B 10 10