
Page 87 - Applied Statistics And Probability For Engineers
P. 87
PQ220 6234F.Ch 03 13/04/2002 03:19 PM Page 65
3-3 CUMULATIVE DISTRIBUTION FUNCTIONS 65
F(x) F(x)
1.0 1.000
0.997
0.886
0.7
0.2
–2 0 2 x 0 1 2 x
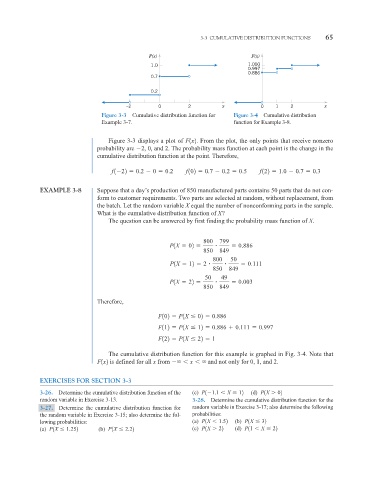
Figure 3-3 Cumulative distribution function for Figure 3-4 Cumulative distribution
Example 3-7. function for Example 3-8.
Figure 3-3 displays a plot of F1x2. From the plot, the only points that receive nonzero
probability are 2, 0, and 2. The probability mass function at each point is the change in the
cumulative distribution function at the point. Therefore,
f 1 22 0.2 0 0.2 f 102 0.7 0.2 0.5 f 122 1.0 0.7 0.3
EXAMPLE 3-8 Suppose that a day’s production of 850 manufactured parts contains 50 parts that do not con-
form to customer requirements. Two parts are selected at random, without replacement, from
the batch. Let the random variable X equal the number of nonconforming parts in the sample.
What is the cumulative distribution function of X?
The question can be answered by first finding the probability mass function of X.
800 799
P1X 02 0.886
850 849
800 50
P1X 12 2 0.111
850 849
50 49
P1X 22 0.003
850 849
Therefore,
F102 P1X 02 0.886
F112 P1X 12 0.886 0.111 0.997
F122 P1X 22 1
The cumulative distribution function for this example is graphed in Fig. 3-4. Note that
F1x2 is defined for all x from
x
and not only for 0, 1, and 2.
EXERCISES FOR SECTION 3-3
3-26. Determine the cumulative distribution function of the (c) P1 1.1 X 12 (d) P1X 02
random variable in Exercise 3-13. 3-28. Determine the cumulative distribution function for the
3-27. Determine the cumulative distribution function for random variable in Exercise 3-17; also determine the following
the random variable in Exercise 3-15; also determine the fol- probabilities:
lowing probabilities: (a) P1X 1.52 (b) P1X 32
(a) P1X 1.252 (b) P1X 2.22 (c) P1X 22 (d) P11 X 22