
Page 223 - Applied statistics and probability for engineers
P. 223
Section 6-1/Numerical Summaries of Data 201
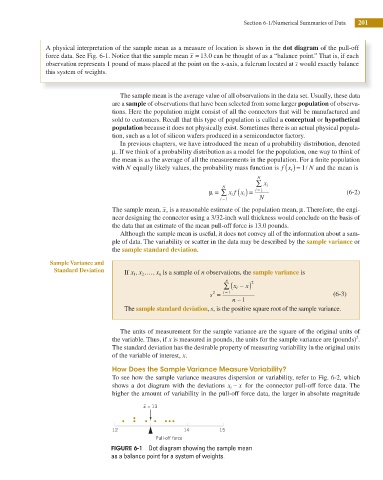
A physical interpretation of the sample mean as a measure of location is shown in the dot diagram of the pull-off
force data. See Fig. 6-1. Notice that the sample mean x = 13 0. can be thought of as a “balance point.” That is, if each
observation represents 1 pound of mass placed at the point on the x-axis, a fulcrum located at x would exactly balance
this system of weights.
The sample mean is the average value of all observations in the data set. Usually, these data
are a sample of observations that have been selected from some larger population of observa-
tions. Here the population might consist of all the connectors that will be manufactured and
sold to customers. Recall that this type of population is called a conceptual or hypothetical
population because it does not physically exist. Sometimes there is an actual physical popula-
tion, such as a lot of silicon wafers produced in a semiconductor factory.
In previous chapters, we have introduced the mean of a probability distribution, denoted
μ. If we think of a probability distribution as a model for the population, one way to think of
the mean is as the average of all the measurements in the population. For a i nite population
with N equally likely values, the probability mass function is f x i ( ) = 1/ N and the mean is
N
∑ x i
N
μ = ∑ x f ( ) =x i i = 1 (6-2)
i
i − 1 N
The sample mean, x, is a reasonable estimate of the population mean, μ. Therefore, the engi-
neer designing the connector using a 3/32-inch wall thickness would conclude on the basis of
the data that an estimate of the mean pull-off force is 13.0 pounds.
Although the sample mean is useful, it does not convey all of the information about a sam-
ple of data. The variability or scatter in the data may be described by the sample variance or
the sample standard deviation.
Sample Variance and
Standard Deviation If x , x , … , x n is a sample of n observations, the sample variance is
2
1
n 2
∑ ( x i − )
x
2
s = i = 1 (6-3)
−
n 1
The sample standard deviation, s, is the positive square root of the sample variance.
The units of measurement for the sample variance are the square of the original units of
2
the variable. Thus, if x is measured in pounds, the units for the sample variance are (pounds) .
The standard deviation has the desirable property of measuring variability in the original units
of the variable of interest, x.
How Does the Sample Variance Measure Variability?
To see how the sample variance measures dispersion or variability, refer to Fig. 6-2, which
shows a dot diagram with the deviations x i − x for the connector pull-off force data. The
higher the amount of variability in the pull-off force data, the larger in absolute magnitude
x = 13
12 14 15
Pull-off force
FIGURE 6-1 Dot diagram showing the sample mean
as a balance point for a system of weights.