
Page 227 - Applied statistics and probability for engineers
P. 227
Section 6-1/Numerical Summaries of Data 205
Exercises FOR SECTION 6-1
Problem available in WileyPLUS at instructor’s discretion.
Tutoring problem available in WileyPLUS at instructor’s discretion.
6-1. Will the sample mean always correspond to one of the mean falls on this diagram. Give a practical interpretation of
observations in the sample? the sample mean.
6-2. Will exactly half of the observations in a sample fall 6-13. The April 22, 1991, issue of Aviation Week and
below the mean? Space Technology reported that during Operation Desert
6-3. Will the sample mean always be the most frequently Storm, U.S. Air Force F-117A pilots lew 1270 combat sor-
occurring data value in the sample? ties for a total of 6905 hours. What is the mean duration of an
6-4. For any set of data values, is it possible for the sample F-117A mission during this operation? Why is the parameter
standard deviation to be larger than the sample mean? If so, you have calculated a population mean?
give an example. 6-14. Preventing fatigue crack propagation in aircraft structures
6-5. Can the sample standard deviation be equal to zero? If so, is an important element of aircraft safety. An engineering study
give an example. to investigate fatigue crack in n = 9 cyclically loaded wing boxes
6-6. Suppose that you add 10 to all of the observations in a reported the following crack lengths (in mm): 2.13, 2.96, 3.02,
sample. How does this change the sample mean? How does it 1.82, 1.15, 1.37, 2.04, 2.47, 2.60. Calculate the sample mean and
change the sample standard deviation? sample standard deviation. Prepare a dot diagram of the data.
6-7. Eight measurements were made on the inside diam- 6-15. An article in the Journal of Physiology [“Response of Rat
eter of forged piston rings used in an automobile engine. The Muscle to Acute Resistance Exercise Deined by Transcriptional
data (in millimeters) are 74.001, 74.003, 74.015, 74.000, and Translational Proiling” (2002, Vol. 545, pp. 27–41)] studied
74.005, 74.002, 74.005, and 74.004. Calculate the sample gene expression as a function of resistance exercise. Expression
mean and sample standard deviation, construct a dot diagram, data (measures of gene activity) from one gene are shown in the
and comment on the data. following table. One group of rats was exercised for six hours
6-8. In Applied Life Data Analysis (Wiley, while the other received no exercise. Compute the sample mean
1982), Wayne Nelson presents the breakdown time of an insulat- and standard deviation of the exercise and no-exercise groups sep-
ing luid between electrodes at 34 kV. The times, in minutes, are arately. Construct a dot diagram for the exercise and no-exercise
as follows: 0.19, 0.78, 0.96, 1.31, 2.78, 3.16, 4.15, 4.67, 4.85, groups separately. Comment on any differences for the groups.
6.50, 7.35, 8.01, 8.27, 12.06, 31.75, 32.52, 33.91, 36.71, and
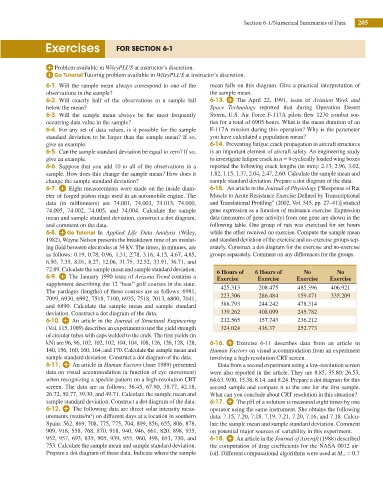
72.89. Calculate the sample mean and sample standard deviation. 6 Hours of 6 Hours of No No
6-9. The January 1990 issue of Arizona Trend contains a Exercise Exercise Exercise Exercise
supplement describing the 12 “best” golf courses in the state. 425.313 208.475 485.396 406.921
The yardages (lengths) of these courses are as follows: 6981,
7099, 6930, 6992, 7518, 7100, 6935, 7518, 7013, 6800, 7041, 223.306 286.484 159.471 335.209
and 6890. Calculate the sample mean and sample standard 388.793 244.242 478.314
deviation. Construct a dot diagram of the data. 139.262 408.099 245.782
6-10. An article in the Journal of Structural Engineering 212.565 157.743 236.212
(Vol. 115, 1989) describes an experiment to test the yield strength 324.024 436.37 252.773
of circular tubes with caps welded to the ends. The irst yields (in
kN) are 96, 96, 102, 102, 102, 104, 104, 108, 126, 126, 128, 128, 6-16. Exercise 6-11 describes data from an article in
140, 156, 160, 160, 164, and 170. Calculate the sample mean and Human Factors on visual accommodation from an experiment
sample standard deviation. Construct a dot diagram of the data. involving a high-resolution CRT screen.
6-11. An article in Human Factors (June 1989) presented Data from a second experiment using a low-resolution screen
data on visual accommodation (a function of eye movement) were also reported in the article. They are 8.85, 35.80, 26.53,
when recognizing a speckle pattern on a high-resolution CRT 64.63, 9.00, 15.38, 8.14, and 8.24. Prepare a dot diagram for this
screen. The data are as follows: 36.45, 67.90, 38.77, 42.18, second sample and compare it to the one for the irst sample.
26.72, 50.77, 39.30, and 49.71. Calculate the sample mean and What can you conclude about CRT resolution in this situation?
sample standard deviation. Construct a dot diagram of the data. 6-17. The pH of a solution is measured eight times by one
6-12. The following data are direct solar intensity meas- operator using the same instrument. She obtains the following
2
urements (watts/m ) on different days at a location in southern data: 7.15, 7.20, 7.18, 7.19, 7.21, 7.20, 7.16, and 7.18. Calcu-
Spain: 562, 869, 708, 775, 775, 704, 809, 856, 655, 806, 878, late the sample mean and sample standard deviation. Comment
909, 918, 558, 768, 870, 918, 940, 946, 661, 820, 898, 935, on potential major sources of variability in this experiment.
952, 957, 693, 835, 905, 939, 955, 960, 498, 653, 730, and 6-18. An article in the Journal of Aircraft (1988) described
753. Calculate the sample mean and sample standard deviation. the computation of drag coeficients for the NASA 0012 air-
Prepare a dot diagram of these data. Indicate where the sample foil. Different computational algorithms were used at M ∞ = .0 7