Page 230 - Applied statistics and probability for engineers
P. 230

208    Chapter 6/Descriptive Statistics


                                     Stem              Leaf                  Frequency
                                     7             6                             1
                                     8             7                             1
                                     9             7                             1
                                     10            5 1                            2
                                     11            5 8 0                          3
                                     12            1 0 3                          3
                                     13            4 1 3 5 3 5                    6
                                     14            2 9 5 8 3 1 6 9                8
                                     15            4 7 1 3 4 0 8 8 6 8 0 8      12
                                     16            3 0 7 3 0 5 0 8 7 9          10
                                     17            8 5 4 4 1 6 2 1 0 6          10
                                     18            0 3 6 1 4 1 0                  7
                                     19            9 6 0 9 3 4                    6
                                     20            7 1 0 8                        4
                                     21            8                             1
                                     22            1 8 9                          3
                                     23            7                             1
                                     24            5                             1
                                   Stem:  Tens and hundreds digits (psi); Leaf: Ones digits (psi).
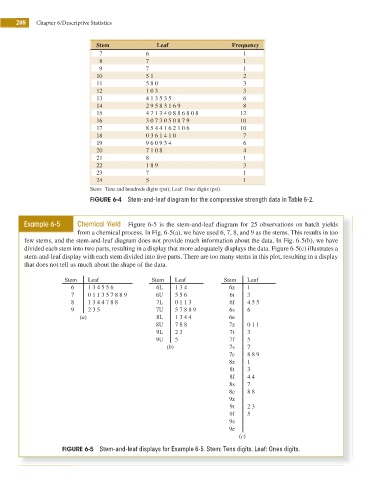
                                   FIGURE 6-4  Stem-and-leaf diagram for the compressive strength data in Table 6-2.


               Example 6-5     Chemical Yield  Figure 6-5 is the stem-and-leaf diagram for 25 observations on batch yields
                               from a chemical process. In Fig. 6-5(a), we have used 6, 7, 8, and 9 as the stems. This results in too
               few stems, and the stem-and-leaf diagram does not provide much information about the data. In Fig. 6-5(b), we have
               divided each stem into two parts, resulting in a display that more adequately displays the data. Figure 6-5(c) illustrates a

               stem-and-leaf display with each stem divided into ive parts. There are too many stems in this plot, resulting in a display
               that does not tell us much about the shape of the data.
                           Stem   Leaf               Stem   Leaf           Stem   Leaf
                             6    1 3 4 5 5 6          6L   1 3 4           6z    1
                             7    0 1 1 3 5 7 8 8 9   6U    5 5 6            6t   3
                             8    1 3 4 4 7 8 8        7L   0 1 1 3         6f    4 5 5
                             9    2 3 5               7U    5 7 8 8 9       6s    6
                               (a)                     8L   1 3 4 4         6e
                                                      8U    7 8 8           7z    0 1 1
                                                       9L   2 3              7t   3
                                                      9U    5               7f    5
                                                          (b)               7s    7
                                                                            7e    8 8 9
                                                                            8z    1
                                                                             8t   3
                                                                            8f    4 4
                                                                            8s    7
                                                                            8e    8 8
                                                                            9z
                                                                             9t   2 3
                                                                            9f    5
                                                                            9s
                                                                            9e
                                                                               (c)

                          FIGURE 6-5  Stem-and-leaf displays for Example 6-5. Stem: Tens digits. Leaf: Ones digits.
   225   226   227   228   229   230   231   232   233   234   235