
Page 233 - Applied statistics and probability for engineers
P. 233
Section 6-2/Stem-and-Leaf Diagrams 211
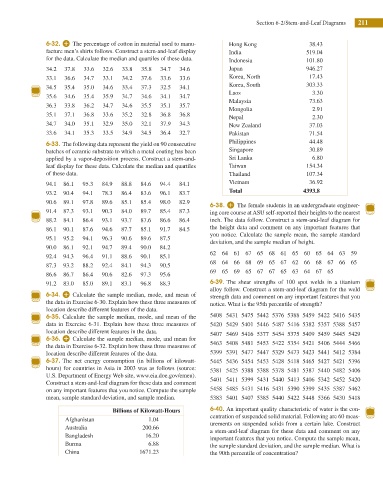
6-32. The percentage of cotton in material used to manu- Hong Kong 38.43
facture men’s shirts follows. Construct a stem-and-leaf display India 519.04
for the data. Calculate the median and quartiles of these data. Indonesia 101.80
34.2 37.8 33.6 32.6 33.8 35.8 34.7 34.6 Japan 946.27
33.1 36.6 34.7 33.1 34.2 37.6 33.6 33.6 Korea, North 17.43
Korea, South 303.33
34.5 35.4 35.0 34.6 33.4 37.3 32.5 34.1
Laos 3.30
35.6 34.6 35.4 35.9 34.7 34.6 34.1 34.7
Malaysia 73.63
36.3 33.8 36.2 34.7 34.6 35.5 35.1 35.7
Mongolia 2.91
35.1 37.1 36.8 33.6 35.2 32.8 36.8 36.8
Nepal 2.30
34.7 34.0 35.1 32.9 35.0 32.1 37.9 34.3 New Zealand 37.03
33.6 34.1 35.3 33.5 34.9 34.5 36.4 32.7 Pakistan 71.54
Philippines 44.48
6-33. The following data represent the yield on 90 consecutive
batches of ceramic substrate to which a metal coating has been Singapore 30.89
applied by a vapor-deposition process. Construct a stem-and- Sri Lanka 6.80
leaf display for these data. Calculate the median and quartiles Taiwan 154.34
of these data. Thailand 107.34
94.1 86.1 95.3 84.9 88.8 84.6 94.4 84.1 Vietnam 36.92
Total 4393.8
93.2 90.4 94.1 78.3 86.4 83.6 96.1 83.7
90.6 89.1 97.8 89.6 85.1 85.4 98.0 82.9
6-38. The female students in an undergraduate engineer-
91.4 87.3 93.1 90.3 84.0 89.7 85.4 87.3 ing core course at ASU self-reported their heights to the nearest
88.2 84.1 86.4 93.1 93.7 87.6 86.6 86.4 inch. The data follow. Construct a stem-and-leaf diagram for
86.1 90.1 87.6 94.6 87.7 85.1 91.7 84.5 the height data and comment on any important features that
you notice. Calculate the sample mean, the sample standard
95.1 95.2 94.1 96.3 90.6 89.6 87.5
deviation, and the sample median of height.
90.0 86.1 92.1 94.7 89.4 90.0 84.2
62 64 61 67 65 68 61 65 60 65 64 63 59
92.4 94.3 96.4 91.1 88.6 90.1 85.1
68 64 66 68 69 65 67 62 66 68 67 66 65
87.3 93.2 88.2 92.4 84.1 94.3 90.5
69 65 69 65 67 67 65 63 64 67 65
86.6 86.7 86.4 90.6 82.6 97.3 95.6
91.2 83.0 85.0 89.1 83.1 96.8 88.3 6-39. The shear strengths of 100 spot welds in a titanium
alloy follow. Construct a stem-and-leaf diagram for the weld
6-34. Calculate the sample median, mode, and mean of strength data and comment on any important features that you
the data in Exercise 6-30. Explain how these three measures of notice. What is the 95th percentile of strength?
location describe different features of the data.
6-35. Calculate the sample median, mode, and mean of the 5408 5431 5475 5442 5376 5388 5459 5422 5416 5435
data in Exercise 6-31. Explain how these three measures of 5420 5429 5401 5446 5487 5416 5382 5357 5388 5457
location describe different features in the data. 5407 5469 5416 5377 5454 5375 5409 5459 5445 5429
6-36. Calculate the sample median, mode, and mean for
the data in Exercise 6-32. Explain how these three measures of 5463 5408 5481 5453 5422 5354 5421 5406 5444 5466
location describe different features of the data. 5399 5391 5477 5447 5329 5473 5423 5441 5412 5384
6-37. The net energy consumption (in billions of kilowatt- 5445 5436 5454 5453 5428 5418 5465 5427 5421 5396
hours) for countries in Asia in 2003 was as follows (source: 5381 5425 5388 5388 5378 5481 5387 5440 5482 5406
U.S. Department of Energy Web site, www.eia.doe.gov/emeu).
Construct a stem-and-leaf diagram for these data and comment 5401 5411 5399 5431 5440 5413 5406 5342 5452 5420
on any important features that you notice. Compute the sample 5458 5485 5431 5416 5431 5390 5399 5435 5387 5462
mean, sample standard deviation, and sample median. 5383 5401 5407 5385 5440 5422 5448 5366 5430 5418
Billions of Kilowatt-Hours 6-40. An important quality characteristic of water is the con-
centration of suspended solid material. Following are 60 meas-
Afghanistan 1.04
urements on suspended solids from a certain lake. Construct
Australia 200.66
a stem-and-leaf diagram for these data and comment on any
Bangladesh 16.20
important features that you notice. Compute the sample mean,
Burma 6.88 the sample standard deviation, and the sample median. What is
China 1671.23 the 90th percentile of concentration?