
Page 229 - Applied statistics and probability for engineers
P. 229
Section 6-2/Stem-and-Leaf Diagrams 207
easy to answer. Because there are many observations, constructing a dot diagram of these data
would be relatively ineficient; more effective displays are available for large data sets.
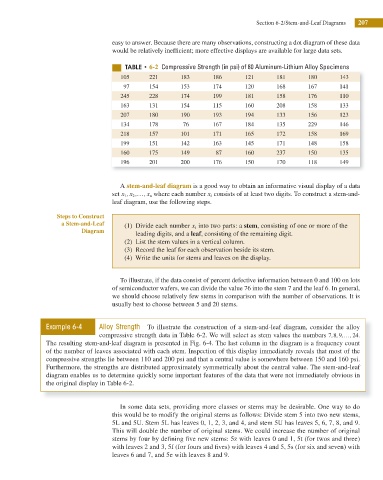
5 6-2 Compressive Strength (in psi) of 80 Aluminum-Lithium Alloy Specimens
105 221 183 186 121 181 180 143
97 154 153 174 120 168 167 141
245 228 174 199 181 158 176 110
163 131 154 115 160 208 158 133
207 180 190 193 194 133 156 123
134 178 76 167 184 135 229 146
218 157 101 171 165 172 158 169
199 151 142 163 145 171 148 158
160 175 149 87 160 237 150 135
196 201 200 176 150 170 118 149
A stem-and-leaf diagram is a good way to obtain an informative visual display of a data
set x , x , … , x n where each number x i consists of at least two digits. To construct a stem-and-
1
2
leaf diagram, use the following steps.
Steps to Construct
a Stem-and-Leaf (1) Divide each number x i into two parts: a stem, consisting of one or more of the
Diagram
leading digits, and a leaf, consisting of the remaining digit.
(2) List the stem values in a vertical column.
(3) Record the leaf for each observation beside its stem.
(4) Write the units for stems and leaves on the display.
To illustrate, if the data consist of percent defective information between 0 and 100 on lots
of semiconductor wafers, we can divide the value 76 into the stem 7 and the leaf 6. In general,
we should choose relatively few stems in comparison with the number of observations. It is
usually best to choose between 5 and 20 stems.
Example 6-4 Alloy Strength To illustrate the construction of a stem-and-leaf diagram, consider the alloy
compressive strength data in Table 6-2. We will select as stem values the numbers 7 8 9, , ,… , 24 .
The resulting stem-and-leaf diagram is presented in Fig. 6-4. The last column in the diagram is a frequency count
of the number of leaves associated with each stem. Inspection of this display immediately reveals that most of the
compressive strengths lie between 110 and 200 psi and that a central value is somewhere between 150 and 160 psi.
Furthermore, the strengths are distributed approximately symmetrically about the central value. The stem-and-leaf
diagram enables us to determine quickly some important features of the data that were not immediately obvious in
the original display in Table 6-2.
In some data sets, providing more classes or stems may be desirable. One way to do
this would be to modify the original stems as follows: Divide stem 5 into two new stems,
5L and 5U. Stem 5L has leaves 0, 1, 2, 3, and 4, and stem 5U has leaves 5, 6, 7, 8, and 9.
This will double the number of original stems. We could increase the number of original
stems by four by dei ning ive new stems: 5z with leaves 0 and 1, 5t (for twos and three)
with leaves 2 and 3, 5f (for fours and ives) with leaves 4 and 5, 5s (for six and seven) with
leaves 6 and 7, and 5e with leaves 8 and 9.