
Page 224 - Applied statistics and probability for engineers
P. 224
202 Chapter 6/Descriptive Statistics
x
some of the deviations x i − will be. Because the deviations x i − always sum to zero, we
x
must use a measure of variability that changes the negative deviations to non-negative quanti-
ties. Squaring the deviations is the approach used in the sample variance. Consequently, if
2
2
s is small, there is relatively little variability in the data, but if s is large, the variability is
relatively large.
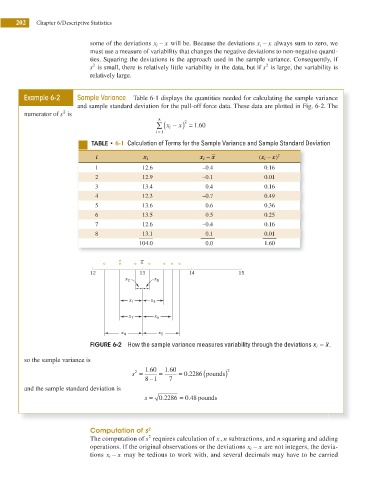
Example 6-2 Sample Variance Table 6-1 displays the quantities needed for calculating the sample variance
and sample standard deviation for the pull-off force data. These data are plotted in Fig. 6-2. The
2
numerator of s is
8
∑ ( x i − ) = 1 60.
2
x
i = 1
5 6-1 Calculation of Terms for the Sample Variance and Sample Standard Deviation
i x i x i − x (x i − ) x 2
1 12.6 –0.4 0.16
2 12.9 –0.1 0.01
3 13.4 0.4 0.16
4 12.3 –0.7 0.49
5 13.6 0.6 0.36
6 13.5 0.5 0.25
7 12.6 –0.4 0.16
8 13.1 0.1 0.01
104.0 0.0 1.60
x
12 13 14 15
x 2 x 8
x 1 x 3
x 7 x 6
x 4 x 5
FIGURE 6-2 How the sample variance measures variability through the deviations x i − .
x
so the sample variance is
.
.
1 60 1 60 2
.
s = = = 0 2286 (pounds )
2
−
8 1 7
and the sample standard deviation is
s = 0 .2286 = .48 pounds
0
Computation of s 2
2
The computation of s requires calculation of x, n subtractions, and n squaring and adding
x
operations. If the original observations or the deviations x i − are not integers, the devia-
x
tions x i − may be tedious to work with, and several decimals may have to be carried