
Page 238 - Applied statistics and probability for engineers
P. 238
216 Chapter 6/Descriptive Statistics
250
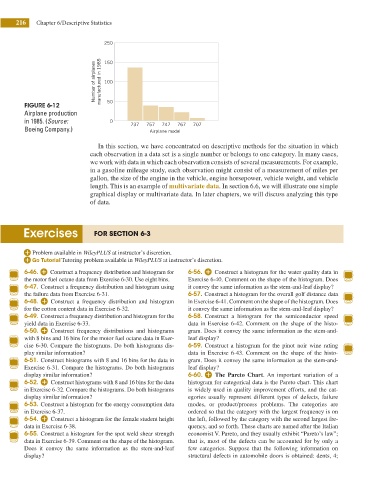
Number of airplanes manufactured in 1985 150
100
FIGURE 6-12 50
Airplane production
in 1985. (Source: 0 737 757 747 767 707
Boeing Company.) Airplane model
In this section, we have concentrated on descriptive methods for the situation in which
each observation in a data set is a single number or belongs to one category. In many cases,
we work with data in which each observation consists of several measurements. For example,
in a gasoline mileage study, each observation might consist of a measurement of miles per
gallon, the size of the engine in the vehicle, engine horsepower, vehicle weight, and vehicle
length. This is an example of multivariate data. In section 6.6, we will illustrate one simple
graphical display or multivariate data. In later chapters, we will discuss analyzing this type
of data.
Exercises FOR SECTION 6-3
Problem available in WileyPLUS at instructor’s discretion.
Tutoring problem available in WileyPLUS at instructor’s discretion.
6-46. Construct a frequency distribution and histogram for 6-56. Construct a histogram for the water quality data in
the motor fuel octane data from Exercise 6-30. Use eight bins. Exercise 6-40. Comment on the shape of the histogram. Does
6-47. Construct a frequency distribution and histogram using it convey the same information as the stem-and-leaf display?
the failure data from Exercise 6-31. 6-57. Construct a histogram for the overall golf distance data
6-48. Construct a frequency distribution and histogram in Exercise 6-41. Comment on the shape of the histogram. Does
for the cotton content data in Exercise 6-32. it convey the same information as the stem-and-leaf display?
6-49. Construct a frequency distribution and histogram for the 6-58. Construct a histogram for the semiconductor speed
yield data in Exercise 6-33. data in Exercise 6-42. Comment on the shape of the histo-
6-50. Construct frequency distributions and histograms gram. Does it convey the same information as the stem-and-
with 8 bins and 16 bins for the motor fuel octane data in Exer- leaf display?
cise 6-30. Compare the histograms. Do both histograms dis- 6-59. Construct a histogram for the pinot noir wine rating
play similar information? data in Exercise 6-43. Comment on the shape of the histo-
6-51. Construct histograms with 8 and 16 bins for the data in gram. Does it convey the same information as the stem-and-
Exercise 6-31. Compare the histograms. Do both histograms leaf display?
display similar information? 6-60. The Pareto Chart. An important variation of a
6-52. Construct histograms with 8 and 16 bins for the data histogram for categorical data is the Pareto chart. This chart
in Exercise 6-32. Compare the histograms. Do both histograms is widely used in quality improvement efforts, and the cat-
display similar information? egories usually represent different types of defects, failure
6-53. Construct a histogram for the energy consumption data modes, or product/process problems. The categories are
in Exercise 6-37. ordered so that the category with the largest frequency is on
6-54. Construct a histogram for the female student height the left, followed by the category with the second largest fre-
data in Exercise 6-38. quency, and so forth. These charts are named after the Italian
6-55. Construct a histogram for the spot weld shear strength economist V. Pareto, and they usually exhibit “Pareto’s law”;
data in Exercise 6-39. Comment on the shape of the histogram. that is, most of the defects can be accounted for by only a
Does it convey the same information as the stem-and-leaf few categories. Suppose that the following information on
display? structural defects in automobile doors is obtained: dents, 4;