Page 243 - Applied statistics and probability for engineers
P. 243

Section 6-5/Time Sequence Plots     221


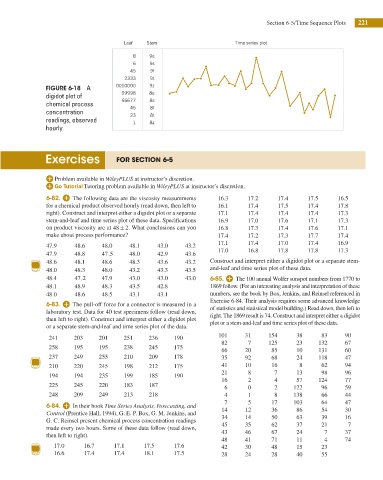
                                             Leaf   Stem                      Time series plot
                                               8    9e
                                               6    9s
                                               45    9f
                                             2333    9t
                     FIGURE 6-18  A       0010000   9z
                     digidot plot of        99998   8e
                                                    8s
                                            66677
                     chemical process          45    8f
                     concentration             23    8t
                     readings, observed        1    8z
                     hourly.


                     Exercises            FOR SECTION 6-5


                         Problem available in WileyPLUS at instructor’s discretion.
                                 Tutoring problem available in WileyPLUS at instructor’s discretion.

                     6-82.     The following data are the viscosity measurements   16.3  17.2  17.4  17.5    16.5
                     for a chemical product observed hourly (read down, then left to   16.1  17.4  17.5  17.4  17.8
                     right). Construct and interpret either a digidot plot or a separate   17.1  17.4  17.4  17.4  17.3
                     stem-and-leaf and time series plot of these data. Speciications   16.9  17.0  17.6  17.1  17.3
                     on product viscosity are at 48 ±  2. What conclusions can you   16.8  17.3  17.4  17.6  17.1
                     make about process performance?                     17.4     17.2     17.3     17.7     17.4
                                                                         17.1     17.4     17.0     17.4     16.9
                     47.9     48.6    48.0    48.1     43.0    43.2
                                                                         17.0     16.8     17.8     17.8     17.3
                     47.9     48.8    47.5    48.0     42.9    43.6
                     48.6     48.1    48.6    48.3     43.6    43.2    Construct and interpret either a digidot plot or a separate stem-
                     48.0     48.3    48.0    43.2     43.3    43.5    and-leaf and time series plot of these data.
                     48.4     47.2    47.9    43.0     43.0    43.0    6-85.     The 100 annual Wolfer sunspot numbers from 1770 to
                     48.1     48.9    48.3    43.5     42.8            1869 follow. (For an interesting analysis and interpretation of these
                     48.0     48.6    48.5    43.1     43.1            numbers, see the book by Box, Jenkins, and Reinsel referenced in
                                                                       Exercise 6-84. Their analysis requires some advanced knowledge
                     6-83.     The pull-off force for a connector is measured in a
                                                                       of statistics and statistical model building.) Read down, then left to
                     laboratory test. Data for 40 test specimens follow (read down,
                                                                       right. The 1869 result is 74. Construct and interpret either a digidot
                     then left to right). Construct and interpret either a digidot plot
                                                                       plot or a stem-and-leaf and time series plot of these data.
                     or a separate stem-and-leaf and time series plot of the data.
                                                                         101     31     154      38     83     90
                      241     203    201     251    236     190
                                                                          82      7     125      23    132     67
                      258     195    195     238    245     175
                                                                          66     20      85      10    131     60
                      237     249    255     210    209     178           35     92      68      24    118     47
                      210     220    245     198    212     175           41     10      16      8      62     94
                                                                          21      8       7      13     98     96
                      194     194    235     199    185     190
                                                                          16      2       4      57    124     77
                      225     245    220     183    187
                                                                           6      0       2     122     96     59
                      248     209    249     213    218                    4      1       8     138     66     44
                                                                           7      5      17     103     64     47
                     6-84.     In their book Time Series Analysis, Forecasting, and
                                                                          14     12      36      86     54     30
                     Control (Prentice Hall, 1994), G. E. P. Box, G. M. Jenkins, and
                                                                          34     14      50      63     39     16
                     G. C. Reinsel present chemical process concentration readings
                                                                          45     35      62      37     21      7
                     made every two hours. Some of these data follow (read down,
                                                                          43     46      67      24      7     37
                     then left to right).
                                                                          48     41      71      11      4     74
                        17.0     16.7     17.1     17.5     17.6          42     30      48      15     23
                        16.6     17.4     17.4     18.1     17.5          28     24      28      40     55
   238   239   240   241   242   243   244   245   246   247   248