
Page 244 - Applied statistics and probability for engineers
P. 244
222 Chapter 6/Descriptive Statistics
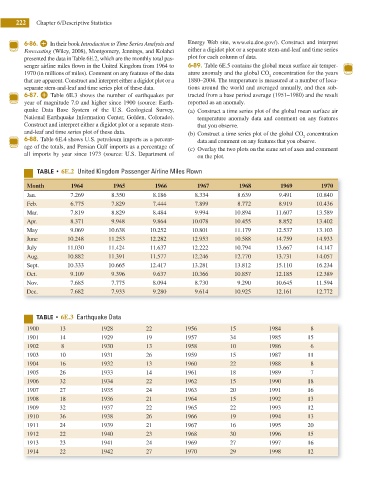
6-86. In their book Introduction to Time Series Analysis and Energy Web site, www.eia.doe.gov/). Construct and interpret
Forecasting (Wiley, 2008), Montgomery, Jennings, and Kolahci either a digidot plot or a separate stem-and-leaf and time series
presented the data in Table 6E.2, which are the monthly total pas- plot for each column of data.
senger airline miles lown in the United Kingdom from 1964 to 6-89. Table 6E.5 contains the global mean surface air temper-
1970 (in millions of miles). Comment on any features of the data ature anomaly and the global CO concentration for the years
2
that are apparent. Construct and interpret either a digidot plot or a 1880–2004. The temperature is measured at a number of loca-
separate stem-and-leaf and time series plot of these data. tions around the world and averaged annually, and then sub-
6-87. Table 6E.3 shows the number of earthquakes per tracted from a base period average (1951–1980) and the result
year of magnitude 7.0 and higher since 1900 (source: Earth- reported as an anomaly.
quake Data Base System of the U.S. Geological Survey, (a) Construct a time series plot of the global mean surface air
National Earthquake Information Center, Golden, Colorado). temperature anomaly data and comment on any features
Construct and interpret either a digidot plot or a separate stem- that you observe.
and-leaf and time series plot of these data. (b) Construct a time series plot of the global CO concentration
2
6-88. Table 6E.4 shows U.S. petroleum imports as a percent- data and comment on any features that you observe.
age of the totals, and Persian Gulf imports as a percentage of
(c) Overlay the two plots on the same set of axes and comment
all imports by year since 1973 (source: U.S. Department of
on the plot.
5"#-& t 6E.2 United Kingdom Passenger Airline Miles Flown
Month 1964 1965 1966 1967 1968 1969 1970
Jan. 7.269 8.350 8.186 8.334 8.639 9.491 10.840
Feb. 6.775 7.829 7.444 7.899 8.772 8.919 10.436
Mar. 7.819 8.829 8.484 9.994 10.894 11.607 13.589
Apr. 8.371 9.948 9.864 10.078 10.455 8.852 13.402
May 9.069 10.638 10.252 10.801 11.179 12.537 13.103
June 10.248 11.253 12.282 12.953 10.588 14.759 14.933
July 11.030 11.424 11.637 12.222 10.794 13.667 14.147
Aug. 10.882 11.391 11.577 12.246 12.770 13.731 14.057
Sept. 10.333 10.665 12.417 13.281 13.812 15.110 16.234
Oct. 9.109 9.396 9.637 10.366 10.857 12.185 12.389
Nov. 7.685 7.775 8.094 8.730 9.290 10.645 11.594
Dec. 7.682 7.933 9.280 9.614 10.925 12.161 12.772
5 6E.3 Earthquake Data
1900 13 1928 22 1956 15 1984 8
1901 14 1929 19 1957 34 1985 15
1902 8 1930 13 1958 10 1986 6
1903 10 1931 26 1959 15 1987 11
1904 16 1932 13 1960 22 1988 8
1905 26 1933 14 1961 18 1989 7
1906 32 1934 22 1962 15 1990 18
1907 27 1935 24 1963 20 1991 16
1908 18 1936 21 1964 15 1992 13
1909 32 1937 22 1965 22 1993 12
1910 36 1938 26 1966 19 1994 13
1911 24 1939 21 1967 16 1995 20
1912 22 1940 23 1968 30 1996 15
1913 23 1941 24 1969 27 1997 16
1914 22 1942 27 1970 29 1998 12