
Page 247 - Applied statistics and probability for engineers
P. 247
Section 6-6/Scatter Diagrams 225
o
Year Anomaly, C CO2, ppmv Year Anomaly, C CO2, ppmv Year Anomaly, C CO2, ppmv
o
o
1911 −0.25 300.1 1953 0.12 311.9 1995 0.47 360.9
1912 −0.33 300.4 1954 −0.09 312.4 1996 0.36 362.6
1913 −0.28 300.8 1955 −0.09 313.0 1997 0.40 363.8
1914 −0.02 301.1 1956 −0.18 313.6 1998 0.71 366.6
1915 0.06 301.4 1957 0.08 314.2 1999 0.43 368.3
1916 −0.20 301.7 1958 0.10 314.9 2000 0.41 369.5
1917 −0.46 302.1 1959 0.05 315.8 2001 0.56 371.0
1918 −0.33 302.4 1960 −0.02 316.6 2002 0.70 373.1
1919 −0.09 302.7 1961 0.10 317.3 2003 0.66 375.6
1920 −0.15 303.0 1962 0.05 318.1 2004 0.60 377.4
1921 −0.04 303.4 1963 0.03 318.7
(source: http://data.giss.nasa.gov/gistemp/)
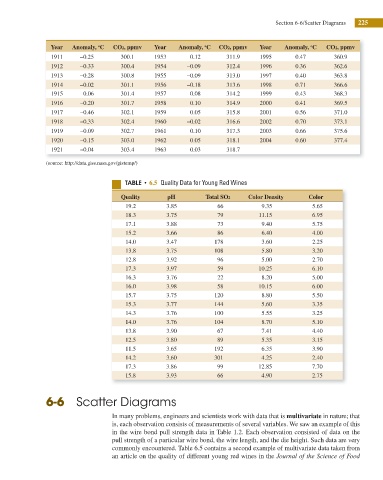
5"#-& t 6.5 Quality Data for Young Red Wines
Quality pH Total SO2 Color Density Color
19.2 3.85 66 9.35 5.65
18.3 3.75 79 11.15 6.95
17.1 3.88 73 9.40 5.75
15.2 3.66 86 6.40 4.00
14.0 3.47 178 3.60 2.25
13.8 3.75 108 5.80 3.20
12.8 3.92 96 5.00 2.70
17.3 3.97 59 10.25 6.10
16.3 3.76 22 8.20 5.00
16.0 3.98 58 10.15 6.00
15.7 3.75 120 8.80 5.50
15.3 3.77 144 5.60 3.35
14.3 3.76 100 5.55 3.25
14.0 3.76 104 8.70 5.10
13.8 3.90 67 7.41 4.40
12.5 3.80 89 5.35 3.15
11.5 3.65 192 6.35 3.90
14.2 3.60 301 4.25 2.40
17.3 3.86 99 12.85 7.70
15.8 3.93 66 4.90 2.75
6-6 Scatter Diagrams
In many problems, engineers and scientists work with data that is multivariate in nature; that
is, each observation consists of measurements of several variables. We saw an example of this
in the wire bond pull strength data in Table 1.2. Each observation consisted of data on the
pull strength of a particular wire bond, the wire length, and the die height. Such data are very
commonly encountered. Table 6.5 contains a second example of multivariate data taken from
an article on the quality of different young red wines in the Journal of the Science of Food