
Page 250 - Applied statistics and probability for engineers
P. 250
228 Chapter 6/Descriptive Statistics
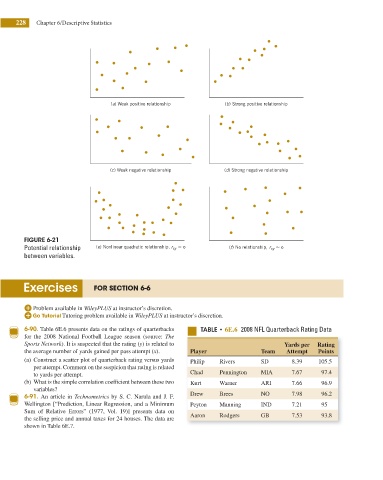
(a) Weak positive relationship (b) Strong positive relationship
(c) Weak negative relationship (d) Strong negative relationship
FIGURE 6-21
Potential relationship (e) Nonlinear quadratic relationship, r xy < o (f) No relationship, r xy < o
between variables.
Exercises FOR SECTION 6-6
Problem available in WileyPLUS at instructor’s discretion.
Tutoring problem available in WileyPLUS at instructor’s discretion.
6-90. Table 6E.6 presents data on the ratings of quarterbacks 5 6E.6 2008 NFL Quarterback Rating Data
for the 2008 National Football League season (source: The
Sports Network). It is suspected that the rating (y) is related to Yards per Rating
the average number of yards gained per pass attempt (x). Player Team Attempt Points
(a) Construct a scatter plot of quarterback rating versus yards Philip Rivers SD 8.39 105.5
per attempt. Comment on the suspicion that rating is related
Chad Pennington MIA 7.67 97.4
to yards per attempt.
(b) What is the simple correlation coeficient between these two Kurt Warner ARI 7.66 96.9
variables?
Drew Brees NO 7.98 96.2
6-91. An article in Technometrics by S. C. Narula and J. F.
Wellington [“Prediction, Linear Regression, and a Minimum Peyton Manning IND 7.21 95
Sum of Relative Errors” (1977, Vol. 19)] presents data on
Aaron Rodgers GB 7.53 93.8
the selling price and annual taxes for 24 houses. The data are
shown in Table 6E.7.