
Page 245 - Applied statistics and probability for engineers
P. 245
Section 6-5/Time Sequence Plots 223
1915 18 1943 41 1971 23 1999 18
1916 25 1944 31 1972 20 2000 15
1917 21 1945 27 1973 16 2001 16
1918 21 1946 35 1974 21 2002 13
1919 14 1947 26 1975 21 2003 15
1920 8 1948 28 1976 25 2004 16
1921 11 1949 36 1977 16 2005 11
1922 14 1950 39 1978 18 2006 11
1923 23 1951 21 1979 15 2007 18
1924 18 1952 17 1980 18 2008 12
1925 17 1953 22 1981 14 2009 15
1926 19 1954 17 1982 10
1927 20 1955 19 1983 15
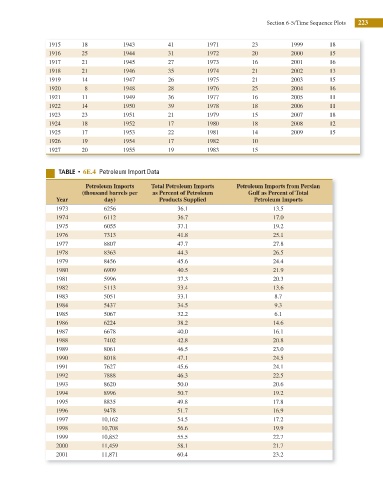
5"#-& t 6E.4 Petroleum Import Data
Petroleum Imports Total Petroleum Imports Petroleum Imports from Persian
(thousand barrels per as Percent of Petroleum Gulf as Percent of Total
Year day) Products Supplied Petroleum Imports
1973 6256 36.1 13.5
1974 6112 36.7 17.0
1975 6055 37.1 19.2
1976 7313 41.8 25.1
1977 8807 47.7 27.8
1978 8363 44.3 26.5
1979 8456 45.6 24.4
1980 6909 40.5 21.9
1981 5996 37.3 20.3
1982 5113 33.4 13.6
1983 5051 33.1 8.7
1984 5437 34.5 9.3
1985 5067 32.2 6.1
1986 6224 38.2 14.6
1987 6678 40.0 16.1
1988 7402 42.8 20.8
1989 8061 46.5 23.0
1990 8018 47.1 24.5
1991 7627 45.6 24.1
1992 7888 46.3 22.5
1993 8620 50.0 20.6
1994 8996 50.7 19.2
1995 8835 49.8 17.8
1996 9478 51.7 16.9
1997 10,162 54.5 17.2
1998 10,708 56.6 19.9
1999 10,852 55.5 22.7
2000 11,459 58.1 21.7
2001 11,871 60.4 23.2