Page 58 - Applied statistics and probability for engineers
P. 58

36   Chapter 2/Probability


                                                       (
                                                     P H ∩  C) = 112 940
                                                                   /
               The event H ∪ C is the event that a wafer is from the center of the sputtering tool or contains high levels of contamination
                                                                             (
                                                /
               (or both). From the table, P H(  ∪ C) = 872 940 . An alternative calculation of P H ∪ C) can be obtained as follows. The
               112 wafers in the event H ∩ C are included once in the calculation of P H( ) and again in the calculation of P C( ). Therefore,
                (
               P H ∪ C) can be determined to be
                                         (
                                                  P H) + (
                                                              P H ⎟
                                       P H ∪ C) = (     P C) − (    C)
                                                         +
                                                     /
                                                                       /
                                                                                /
                                                = 358 940 626 940  −112 940  = 872 940
                                                              /
                 Practical Interpretation: To better understand the sources of contamination, yield from defferent locations on wafers
               are routinely aggregated.
                   5    2-1   Wafers in Semiconductor Manufacturing Classifi ed by
                             Contamination and Location
                                      Location in Sputtering Tool
               Contamination       Center             Edge              Total
                    Low             514                68               582
                   High             112               246               358
                   Total            626               314

                                                                                                       (
                                     The preceding example illustrates that the probability of A or B is interpreted as P A∪ B)
                                   and that the following general addition rule applies.
                      Probability of
                                                                  P A) + (
                          a Union                        (    B) = (    P B) − (    B)
                                                        P A∪                  P A⎟                   (2-5)


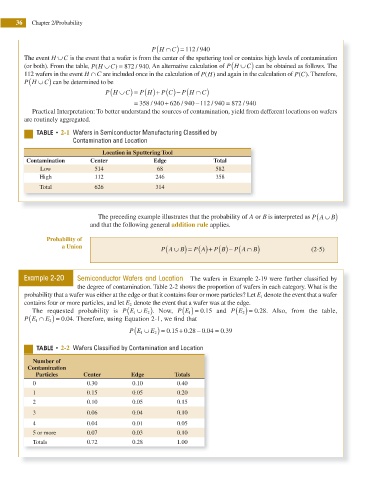
               Example 2-20    Semiconductor Wafers and Location  The wafers in Example 2-19 were further classii ed by
                               the degree of contamination. Table 2-2 shows the proportion of wafers in each category. What is the
               probability that a wafer was either at the edge or that it contains four or more particles? Let E 1  denote the event that a wafer
               contains four or more particles, and let E 2  denote the event that a wafer was at the edge.
                                              (
                                                                                     .
                 The requested probability is P E 1 ∪ ). Now, P E 1 ( ) =  0 15  and P E 2 ( ) =  0 28. Also, from the table,
                                                                     .
                                                   E 2
                (
                           .
               P E 1 ∩ ) =  0 04. Therefore, using Equation 2-1, we i nd that
                     E 2
                                                (
                                                          0 15 0 28 0 04 = .
                                              P E 1 ∪ ) = .  + .   − .    0 39
                                                     E 2
                   5"#-& t 2-2  Wafers Classifi ed by Contamination and Location
                 Number of
                Contamination
                  Particles      Center        Edge         Totals
                 0                0.30         0.10          0.40
                 1                0.15         0.05          0.20
                 2                0.10         0.05          0.15
                 3                0.06         0.04          0.10
                 4                0.04         0.01          0.05
                 5 or more        0.07         0.03          0.10
                 Totals           0.72         0.28          1.00
   53   54   55   56   57   58   59   60   61   62   63