
Page 106 - Applied Statistics Using SPSS, STATISTICA, MATLAB and R
P. 106
3.2 Estimating a Mean 85
In Chapter 1, section 1.5, we introduced the notions of confidence level and
interval estimates, in order to illustrate the special nature of statistical statements
and to advise taking precautions when interpreting them. We will now proceed to
apply these concepts to several descriptive statistics that were presented in the
previous chapter.
3.2 Estimating a Mean
We now estimate the mean of a random variable X using a confidence interval
around the sample mean, instead of a single measurement as in the previous
section. Let x = [ 1 x ,K x , n ]x , ’ be a random sample from a population, described
2
by the random variable X with mean µ and standard deviation σ. Let x be the
arithmetic mean:
x = ∑ n = i 1 x i n / . 3.7
Therefore, x is a function t n(x) as in the general formulation of the previous
section. The sampling distribution of X (whose values are x ), taking into account
the properties of a sum of i.i.d. random variables (see section A.8.4), has the same
mean as X and a standard deviation given by:
σ X = σ X / n ≡ σ / n . 3.8
4 n 0,σ/√n
3.6
3.2 n = 100
2.8
2.4
2
1.6
1.2 n = 25
0.8
n = 5
0.4 n = 1
0 x
-3 -2.5 -2 -1.5 -1 -0.5 0 0.5 1 1.5 2 2.5 3
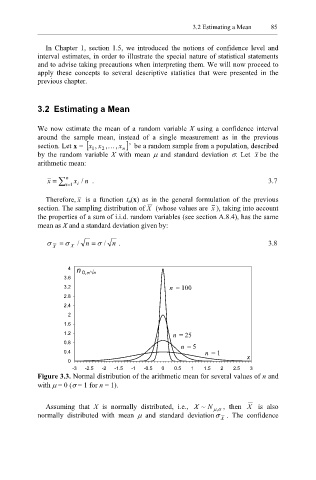
Figure 3.3. Normal distribution of the arithmetic mean for several values of n and
with µ = 0 (σ = 1 for n = 1).
Assuming that X is normally distributed, i.e., X ~ N µ σ , , then X is also
normally distributed with mean µ and standard deviationσ . The confidence
X