
Page 110 - Applied Statistics Using SPSS, STATISTICA, MATLAB and R
P. 110
3.2 Estimating a Mean 89
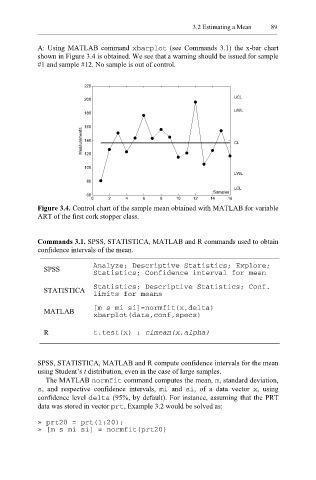
A: Using MATLAB command xbarplo t (see Commands 3.1) the x-bar chart
shown in Figure 3.4 is obtained. We see that a warning should be issued for sample
#1 and sample #12. No sample is out of control.
220
200 UCL
UWL
180
160
Measurements 140 CL
120
100
LWL
80
LCL
Samples
60
0 2 4 6 8 10 12 14 16
Figure 3.4. Control chart of the sample mean obtained with MATLAB for variable
ART of the first cork stopper class.
Commands 3.1. SPSS, STATISTICA, MATLAB and R commands used to obtain
confidence intervals of the mean.
SPSS Analyze; Descriptive Statistics; Explore;
Statistics; Confidence interval for mean
STATISTICA Statistics; Descriptive Statistics; Conf.
limits for means
MATLAB [m s mi si]=normfit(x,delta)
xbarplot(data,conf,specs)
R t.test(x) ; cimean(x,alpha)
SPSS, STATISTICA, MATLAB and R compute confidence intervals for the mean
using Student’s t distribution, even in the case of large samples.
The MATLAB normfit command computes the mean, m , standard deviation,
s , and respective confidence intervals, mi and si , of a data vector x , using
confidence level delta (95%, by default). For instance, assuming that the PRT
data was stored in vector prt , Example 3.2 would be solved as:
» prt20 = prt(1:20);
» [m s mi si] = normfit(prt20)