
Page 148 - Applied Statistics Using SPSS, STATISTICA, MATLAB and R
P. 148
128 4 Parametric Tests of Hypotheses
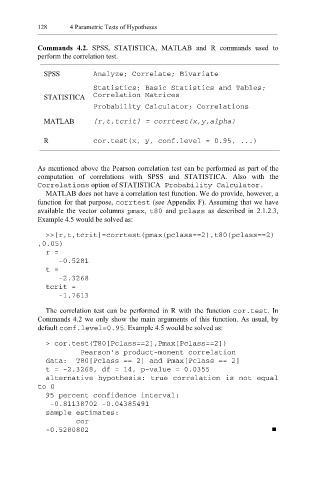
Commands 4.2. SPSS, STATISTICA, MATLAB and R commands used to
perform the correlation test.
SPSS Analyze; Correlate; Bivariate
Statistics; Basic Statistics and Tables;
STATISTICA Correlation Matrices
Probability Calculator; Correlations
MATLAB [r,t,tcrit] = corrtest(x,y,alpha)
R cor.test(x, y, conf.level = 0.95, ...)
As mentioned above the Pearson correlation test can be performed as part of the
computation of correlations with SPSS and STATISTICA. Also with the
Correlations option of STATISTICA Probability Calculator.
MATLAB does not have a correlation test function. We do provide, however, a
function for that purpose, corrtest (see Appendix F). Assuming that we have
available the vector columns pmax , t80 and pclass as described in 2.1.2.3,
Example 4.5 would be solved as:
>>[r,t,tcrit]=corrtest(pmax(pclass==2),t80(pclass==2)
,0.05)
r =
-0.5281
t =
-2.3268
tcrit =
-1.7613
The correlation test can be performed in R with the function cor.t est . In
Commands 4.2 we only show the main arguments of this function. As usual, by
default conf.level=0.95 . Example 4.5 would be solved as:
> cor.test(T80[Pclass==2],Pmax[Pclass==2])
Pearson’s product-moment correlation
data: T80[Pclass == 2] and Pmax[Pclass == 2]
t = -2.3268, df = 14, p-value = 0.0355
alternative hypothesis: true correlation is not equal
to 0
95 percent confidence interval:
-0.81138702 -0.04385491
sample estimates:
cor
-0.5280802